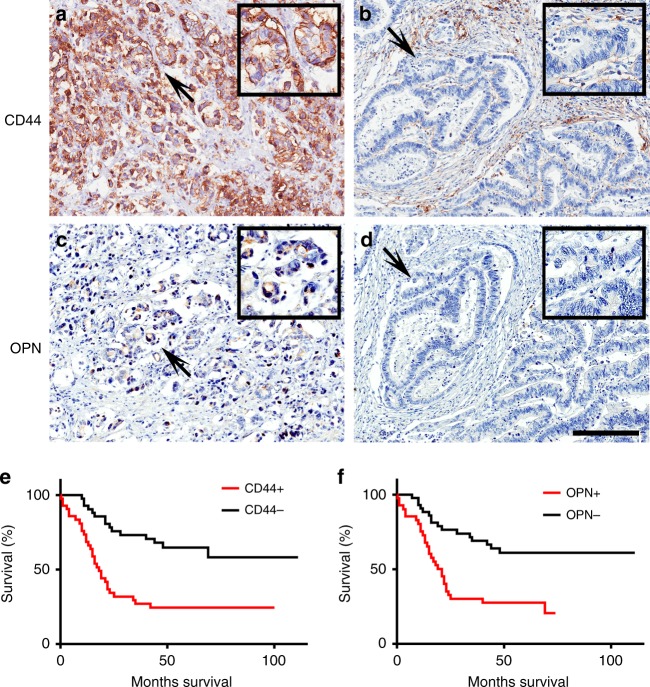
Fig. 6. CD44 and OPN expression in human GEJ cancer correlates with the worse survival of patients.
Representative images of cancer cells with (a, c) and without CD44 (a, b) and OPN (c, d) expression. Arrows indicate areas shown in insets. e, f Kaplan–Meier survival analysis of GEJ cancer patients with CD44 (e, CD44 + n = 42, CD44− n = 42, P < 0.0001) and OPN (f, OPN+ n = 41, OPN− n = 43, P = 0.0002) expression. Combined data set. Elite ABC method and hematoxylin counterstaining (a–d). Scale bar in d represents 200 μm (a–d) and 100 μm (insets in a–d). Source data are provided as a Source Data file.

