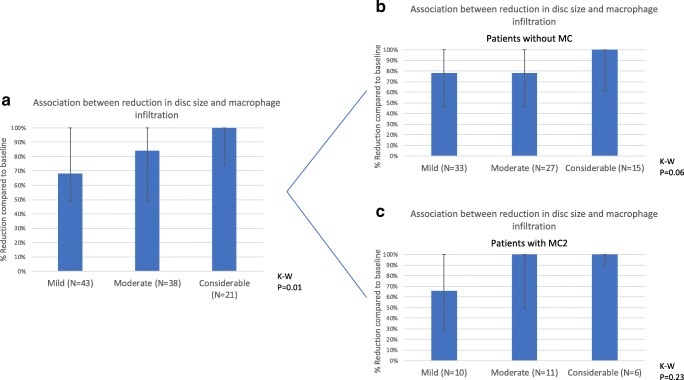
Fig. 4.
Association between the degree of macrophage infiltration and the percentage surface reduction of the HNP between baseline and 1-year follow-up on MRI. Macrophage infiltration groups are shown on the X axis, values on the Y axis are median percentages of axial surface reduction compared to baseline, error bars are interquartile ranges and p values for the Kruskal-Wallis test are provided. Comparison a for the whole population, b for patients without MC, and c for patients with MC

