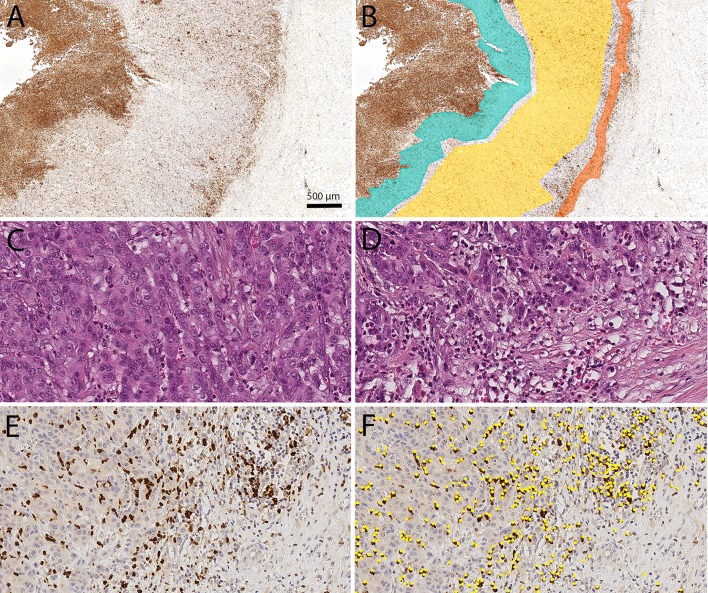
Fig. 1.
Digital image analysis: Digital image analysis was used to quantify the spatial distribution of tumor-associated neutrophils (TANs) in gastric cancer. The viewer and painting program VMP was used to mark the tumor compartments: tumor surface (green), tumor center (yellow) and invasion front (orange; a, b). The TAN density was lower in the tumor center (c) than in the invasion front (d–f). TAN density was quantified by image analysis using Definiens Tissue Studio® (TANs identified by Definiens are marked as yellow dots; f). All figures were captured from the same tumor. Anti-myeloperoxidase immunostaining (a, b, e, f). Hematoxylin and eosin (c, d). Overview (a, b). Original magnification 400-fold (c–f)

