Fig. 2.

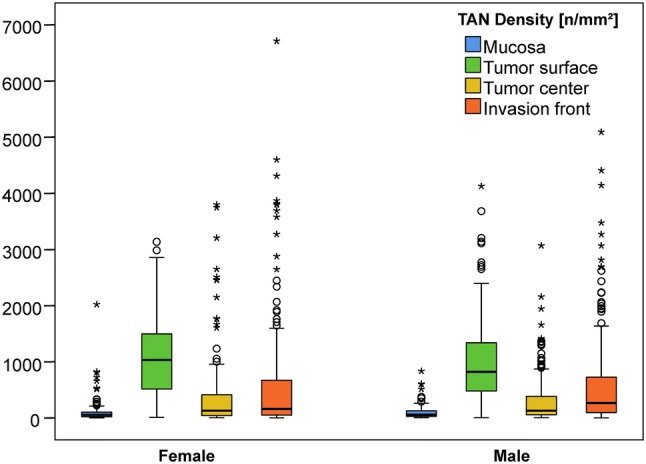
Boxplots: Densities of myeloperoxidase-immunoreactive tumor-associated neutrophils split by sex in the tumor compartments: nonneoplastic peritumoral mucosa (blue), tumor surface (green), tumor center (yellow) and invasion front (orange)

Boxplots: Densities of myeloperoxidase-immunoreactive tumor-associated neutrophils split by sex in the tumor compartments: nonneoplastic peritumoral mucosa (blue), tumor surface (green), tumor center (yellow) and invasion front (orange)