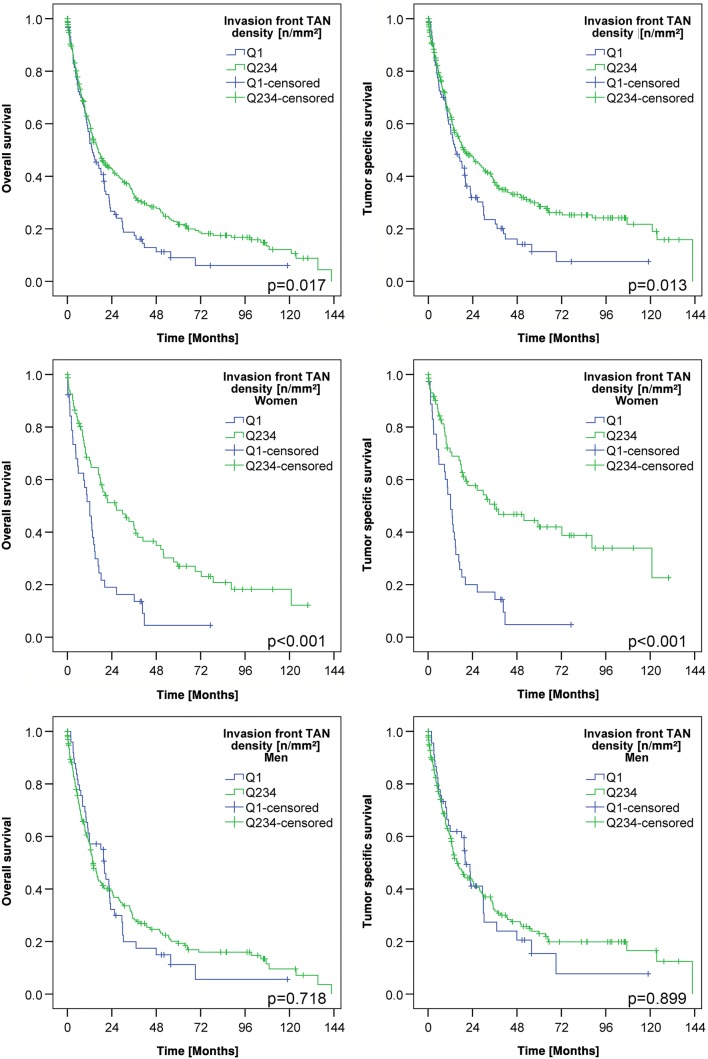
Fig. 3.
Patients’ survival: Kaplan–Meier curves of the entire cohort depicting patients’ overall and tumor-specific survival according to the densities of myeloperoxidase-immunoreactive tumor-associated neutrophils in the invasion front (dichotomized into quartile 1 vs. quartile 2–4; upper panel). Women with a low density of myeloperoxidase-immunoreactive tumor-associated neutrophils had a poorer survival compared to those with a high density of myeloperoxidase-immunoreactive tumor-associated neutrophils (middle panel). This effect could not be shown in men (lower panel). All p values shown in the graph were obtained by log-rank test

