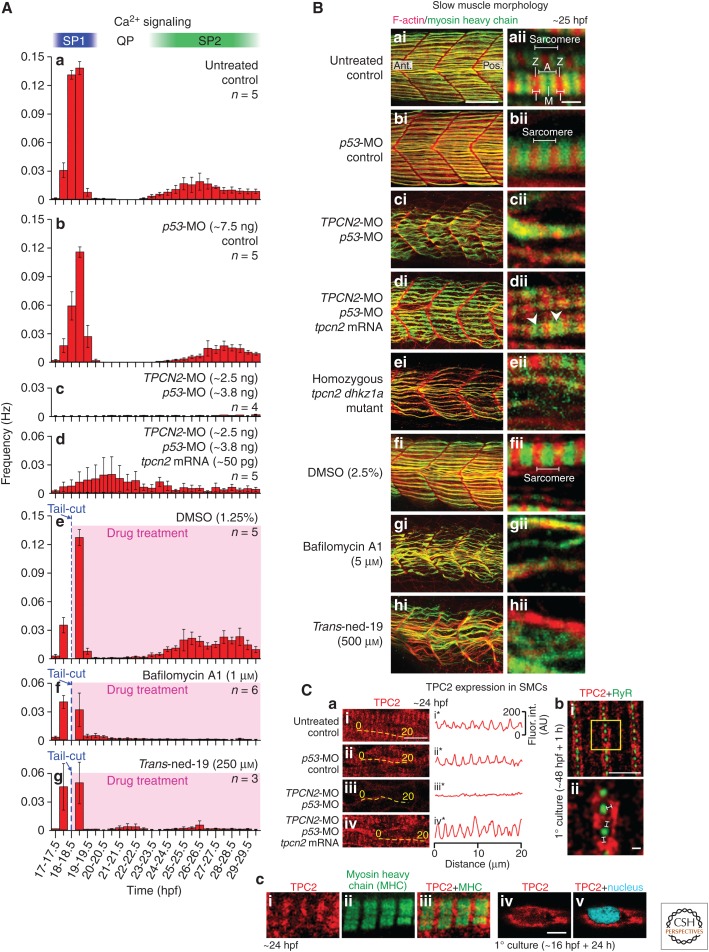
Figure 1.
Role of TPC2 in the differentiation of the slow muscle cells in zebrafish embryos. (A) Effect of morpholino oligonucleotide (MO)-based knockdown (without and with messenger RNA [mRNA] rescue) or pharmacological inhibition of TPC2 on the muscle-generated Ca2+ signals from ∼17 to ∼30 hours post-fertilization (hpf). These histograms show the mean ± SEM frequency of Ca2+ signals generated every 30 min in the trunk musculature in α-actin-aeq transgenic embryos that were (Aa) untreated, (Ab–Ad) injected at the 1- to 4-cell stage with (Ab) p53-MO, (Ac) TPCN2-MO plus p53-MO, or (Ad) TPCN2-MO plus p53-MO and tpcn2 mRNA at the amounts shown; or (Ae–Ag) treated after the SP1 Ca2+ signals were first observed with (Ae) dimethylsulfoxide (DMSO), (Af) bafilomycin A1, or (Ag) trans-ned-19 (at the concentrations shown). Calcium signaling periods 1 and 2 (SP1 and SP2), and the signaling quiet period ([QP]; Cheung et al. 2011) are shown. (B) Effect of MO-based knockdown (± mRNA rescue), CRISPR/Cas9-knockout, or pharmacological inhibition of TPC2 on the organization of the trunk musculature and the formation of sarcomeres. Embryos were (Ba) untreated or (Bb–Bd) injected with (Bb) p53-MO, (Bc) TPCN2-MO plus p53-MO, or (Bd) TPCN2-MO plus p53-MO, and tpcn2 mRNA at the amounts shown in (A). In addition, (Be) shows a representative homozygous tpcn2 dhkz1a mutant, and (Bf–Bh) in some experiments embryos were treated with (Bf) DMSO, (Bg) bafilomycin A1, or (Bh) trans-ned-19 at the concentrations shown. All embryos were fixed at ∼25 hpf and dual-labeled with phalloidin and the F59 antibody to visualize F-actin (in red) and myosin heavy chain (in green) in the trunk musculature, respectively. The panels show a series of optical sections projected as single images at (Bai–Bhi) low and (Baii–Bhii) higher magnification when the red and green channels are merged; overlapping regions are shown in yellow. The higher magnification images of the slow muscle cell myofibers reveal the presence (Baii, Bbii, Beii, Bfii) or absence (Bcii, Bgii, Bhii) of the sarcomeric banding pattern of the F-actin and myosin heavy chain. Morphants that were coinjected with tpcn2 mRNA (Bdii) showed the appearance of some banding (white arrowheads) but not clear sarcomeres. Ant. and Pos. in (Bai) are anterior and posterior, respectively. (C) Localization of TPC2 in the slow muscle cells of (Cai) untreated embryos and in those injected with (Caii) p53-MO, (Caiii) TPCN2-MO plus p53-MO, or (Caiv) TPCN2-MO plus p53-MO, and tpcn2 mRNA (at the amounts shown in (A)) between the 1–4-cell stage and then fixed at 24 hpf prior to immunolabeling. The yellow dashed lines indicate the location of line scan analyses, which were performed along individual myofibers, after which (Cai*–Caiv*) line graphs were plotted to show the change in the pattern of TPC2 expression with the different treatments. (Cb) Visualization of TPC2 and RyR by dual-immunolabeling and dual-color stimulated emission depletion microscopy (STED) superresolution imaging. This is a representative muscle cell that was dissociated from the trunk of a zebrafish embryo at ∼48 hpf, plated onto a coverslip for 1 h, and then fixed and dual-immunolabeled with the 2137A anti-TPC2 and 34C anti-RyR primary antibodies. The region bounded by the yellow square in (Cbi) is shown at higher magnification in (Cbii). The white lines in (Cbii) indicate the presence of distinct gaps between the RyR and TPC2 clusters when observed via STED imaging. (Cc) Expression of TPC2 in a slow muscle cell at ∼24 hpf in relation to (Cci–Cciii) that of the myosin heavy chain, and (Cciv–Ccv) the nucleus. The former images were acquired from intact embryos fixed at ∼24 hpf, whereas the latter images were acquired from primary cultured cells prepared from embryos at ∼16 hpf and then cultured for ∼24 h. Scale bars, 50 µm (Bai–Bhi); 2 µm (Baii–Bhii); 10 µm (Cai–Caiv); 2 µm (Cbi); 200 nm (Cbii); 5 µm (Cc). (A, Ca, and Cc from Kelu et al. 2015; adapted, with permission, from UPV/EHU Press; B and Cb from Kelu et al. 2017; adapted, with permission, from Elsevier.)

