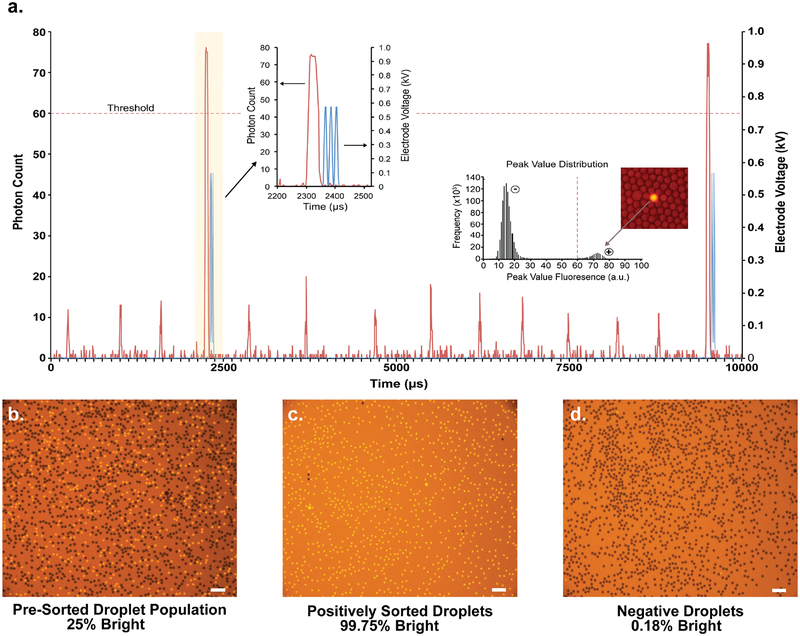
Figure 3. FADS-based sorting of a fluorescent droplet population.
(a) Sample of data acquired during a sorting run (~1.4 kHz) showing the PMT-detected fluorescence signal (red, left axis) produced by positive and negative drops along with the voltage pulse applied to the electrode (blue, right axis) when a positive drop is detected. Insets show a magnified image of the shaded region (left) illustrating a positive drop along with the generated sorting pulse, and the histogram (right) showing the distribution of peak droplet fluorescence values for an active population. Fluorescence microscope images showing the (b) pre-sorted droplet population, (c) positively sorted droplets, and (d) negative droplets. Negative droplets contained an opaque green dye and positive droplets contained 1 μM Cy3-labeled DNA. Scale bars are 100 μm.

