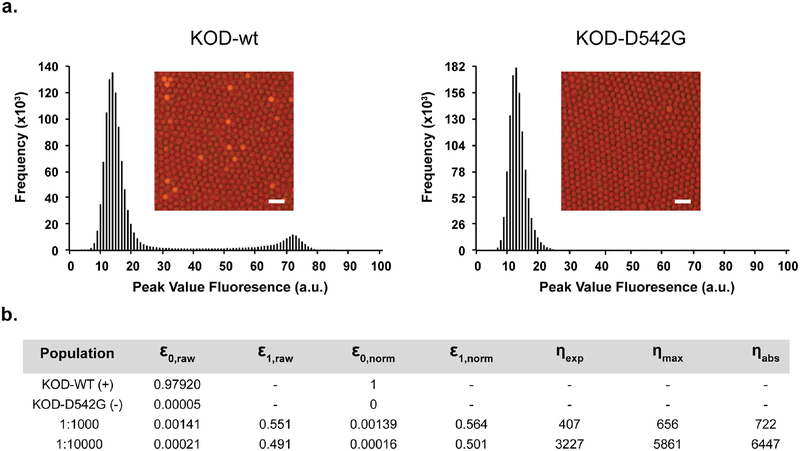
Figure 6. Enrichment assay based on DNA polymerase activity.
a) Images and distributions of peak fluorescence for clonal populations of E. coli expressing wild-type KOD DNA polymerase (left) and a null mutant KOD-D542G (right) encapsulated in droplets. Scale bars are 50 μm. b) Tabulated results and theoretical enrichment values. E. coli expressing wild-type KOD DNA polymerase were spiked at cellular ratios of 1:1000 and 1:10000 into a population of E. coli expressing the null mutant KOD-D542G. ε0 and ε1 represent the fraction of KOD-wt expressing cells in the starting and sorted populations, respectively. Raw ε0 and ε1 values were normalized using experimentally determined false negative and false positive rates obtained from the clonal populations. Experimental enrichment (ηexp) is a ratio of ε1,norm/ε0,norm. The absolute enrichment (ηabs) is 1/ε0,norm, while the maximum theoretical enrichment (ηmax) is mathematically derived based on Poisson statistics.

