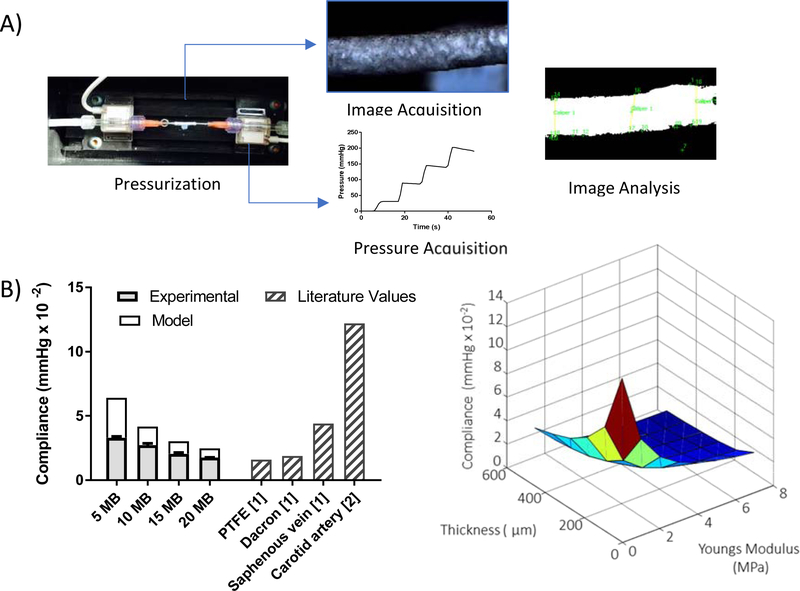
Figure 5. Experimental and model compliance of vascular grafts.
(A) Compliance was measured experimentally using a custom pressurization device, composed of a programmable syringe pump, a holding chamber, a camera and two in-line pressure transducers. Tubes made with concentrations of 8 % w/v for 5MB, 14 % w/v for 10MB, 18 % for 15MB and 25% w/v for 20MB silk solutions were tested. (B) A Finite Element Model was made using ABAQUS simulating the experimental compliance test. The model considered a cylinder fixed at both ends, the longitudinal, radial and circumferential stresses were calculated using quasi static analysis where the cylinder was pressurized from 0 to 200 mm Hg in increments of 0.005 mm Hg. The predicted compliance as a function of thickness and elastic modulus is plotted (right). The predicted compliance, experimental compliance and compliance values derived from literature are compared (left).

