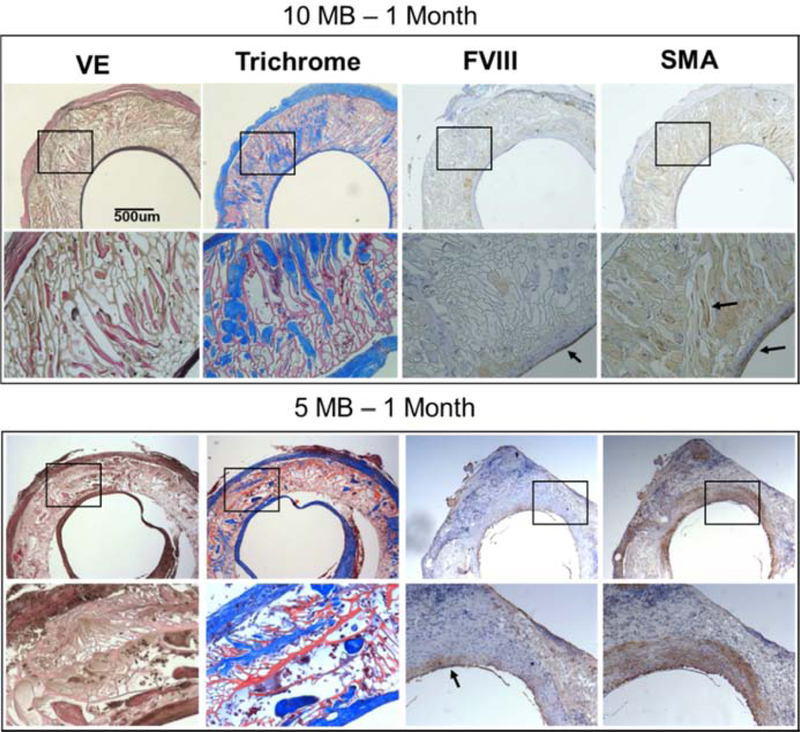
Figure 7. Histological cross-sections of 10 MB (top) and 5 MB grafts 1-month post-implantation.
Adjacent sections were stained for Verhoff’s elastic (VE), trichrome, Factor VIII (FVIII) and smooth muscle actin (SMA). For each stain images are shown in low (20x, top) and high magnification (40x, bottom) corresponding to the box in the image above. Arrows indicate areas of clear positive IHC staining. Histology images shown were taken midgraft The scale bar (500 μm) is common to all images.

