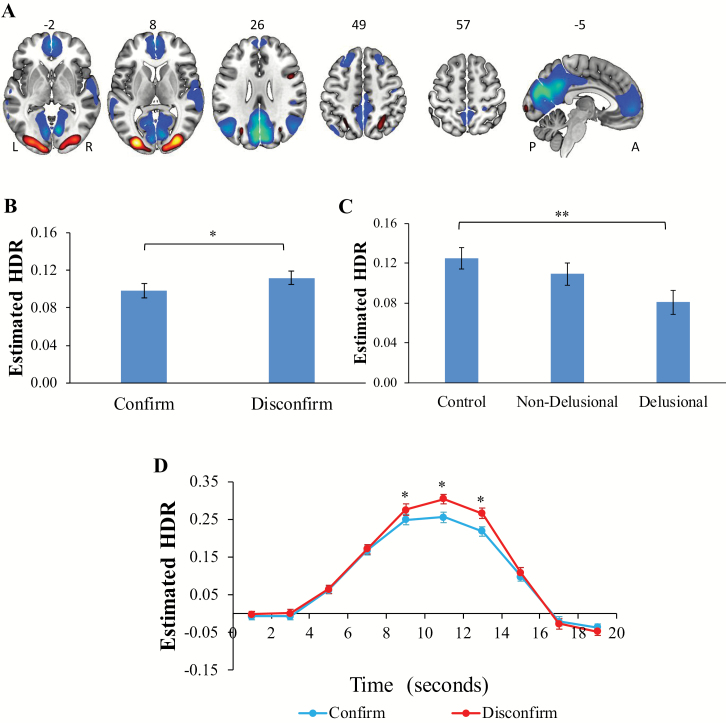
Fig. 3.
(A) Dominant 10% of component loadings for default-mode network (DMN; Component 2: positive loadings, threshold = 0.19, max = 0.35; negative loadings, threshold = –0.19, min = –0.41). Montreal Neurological Institute Z-axis coordinates are displayed; left = left. (B) Estimated DMN hemodynamic response (HDR)-main effect of condition. (C) Main effect of group. (D) Condition × time interaction. *P < .05; **P < .01. A = anterior; L = left; P = posterior; R = right. Error bars = standard errors.

