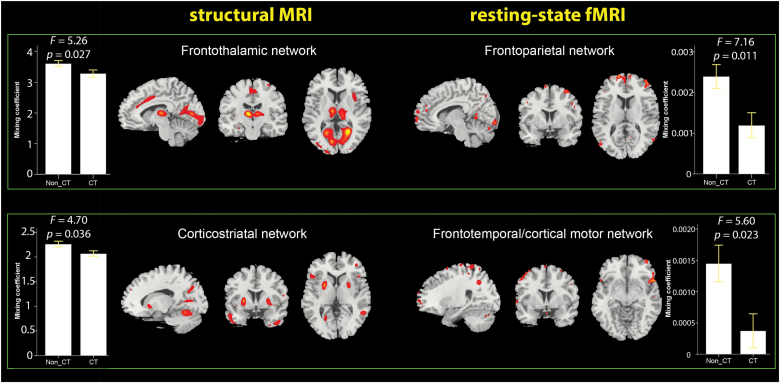
Fig. 1.
Structural and functional networks exhibiting significant differences between catatonic (n = 24) and non-catatonic (n = 22) patients. Bar graphs depict the mean of mixing coefficients for each independent component (IC) in each group. The error bars represent ± 1 standard error of the mean. Analyses of covariance were used to test the effects of group on the mixing coefficients of each IC in structural magnetic resonance imaging (sMRI) and resting-state functional MRI (rs-fMRI) modalities controlled for olanzapine equivalent and Positive and Negative Syndrome Scale total score. The corresponding F and P values for each test are placed above the bar graphs. The regions in both modalities, with a threshold of |z| > 2.5, are shown in sagittal, coronal, and axial planes.

