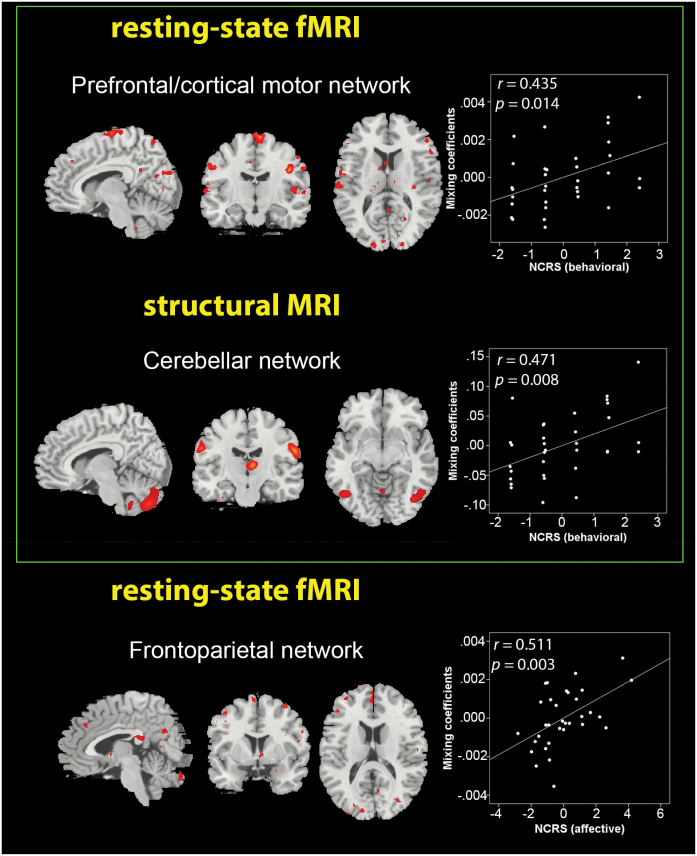
Fig. 2.
Scatter plots depicting the partial correlations (adjusted for olanzapine equivalent and Positive and Negative Syndrome Scale total score) between Northoff Catatonia Rating Scale (NCRS) behavioral and affective scores in schizophrenia spectrum disorders patients with catatonia according to Diagnostic and Statistical Manual of Mental Disorders, Fourth Edition, Text Revision (n = 33) and the mixing coefficients of each independent component in each modality. Corresponding r and P values are placed above each scatter plot. Brain regions in structural magnetic resonance imaging (sMRI) and resting-state functional MRI (rs-fMRI) modalities are shown in sagittal, coronal, and axial slices, with a threshold of |z| > 2.5.

