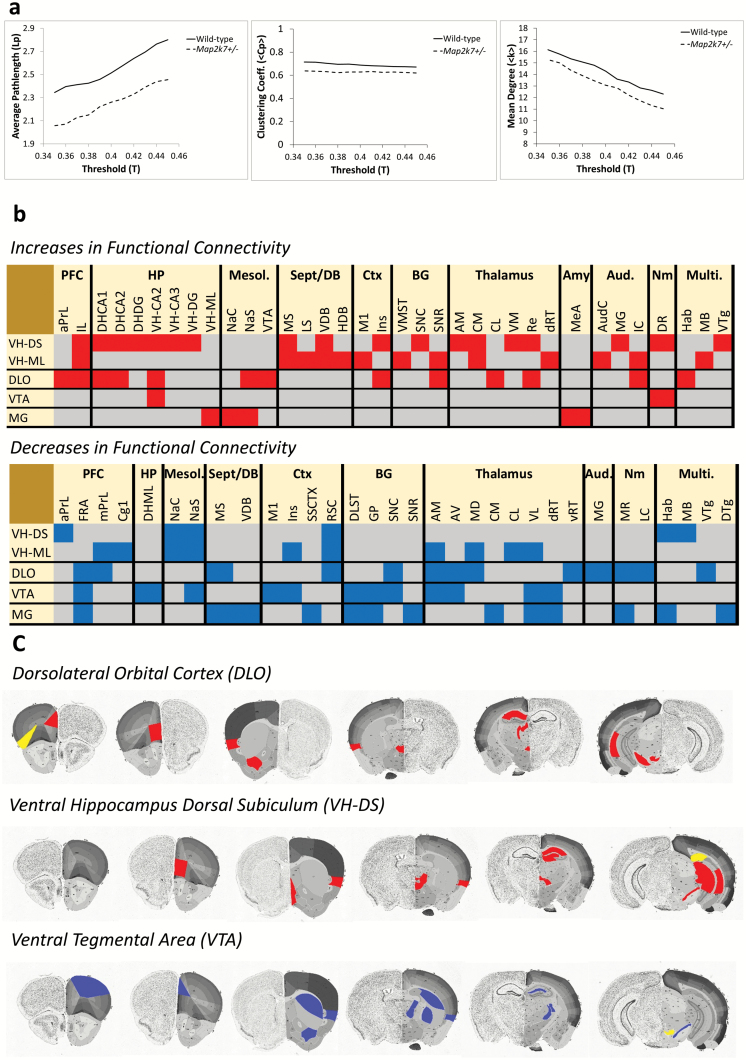
Fig. 2.
Map2k7 +/− mice show altered functional brain network connectivity. (a) Average path length (Lp) is decreased (P = .012) whereas mean degree (<k>) and clustering (Cp) are not altered in Map2k7+/− mice. (b) Heatmaps showing altered inter-regional connectivity in Map2k7+/− mice. Red denotes gained (ventral tegmental area [VIP] 95% CI >0.8 in Mapk7+/−, <0.8 in wild-type [WT] and z-score difference >1.96) and blue denotes lost (VIP 95% CI >0.8 in WT, <0.8 in Map2k7+/− and z-score difference <−1.96) connectivity in Map2k7+/− mice. PFC = prefrontal cortex, HP = hippocampus, Mesol. = mesolimbic system, Sept/DB = septal/diagonal band of Broca, Ctx = cortex, BG = basal ganglia, Aud. = auditory system, Nm = neuromodulatory nuclei, Multi. = multimodal. Full connectivity heatmaps are shown in supplementary figure S2. (c) Brain images showing the anatomical localization of altered inter-regional connectivity in Map2k7+/− mice. Blue denotes lost and red denotes gained connectivity. Brain sections modified from the Allen atlas (mouse.brain-map.org/static/atlas).

