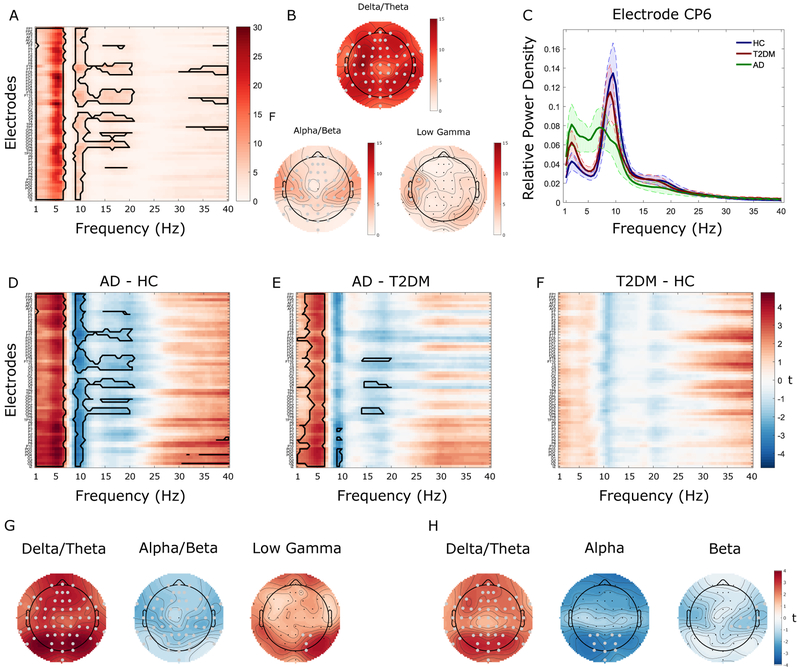
Figure 1. Whole-brain analysis of relative power.
A. F-ratios associated with between-group mass univariate analyses of variance (ANOVAs) comparing relative electroencephalography (EEG) power between Alzheimer’s disease (AD), Type-2 diabetes mellitus (T2DM), and healthy controls (HC) across all electrodes (y-axis) and frequencies (x-axis). The solid black contour represents data points surviving cluster-based multiple comparison correction. B. Topographic representation of the F-ratios averaged across the significant frequencies. C. Mean power spectra (with 95% confidence intervals; CI) for each group separately at the electrode (CP6) for which group differences were maximal. Alpha/beta power showed a linear decrease across groups, being highest for HC and lowest for AD with T2DM having intermediate values whereas delta/theta power showed a linear increase across groups. D-F. T-values associated with follow-up tests comparing relative EEG power between each pair of groups separately. Solid black contours indicate data points surviving cluster-correction. G-H. Topographic representation of the t-values associated with the respective significant effects. Significant electrodes are highlighted in gray.

