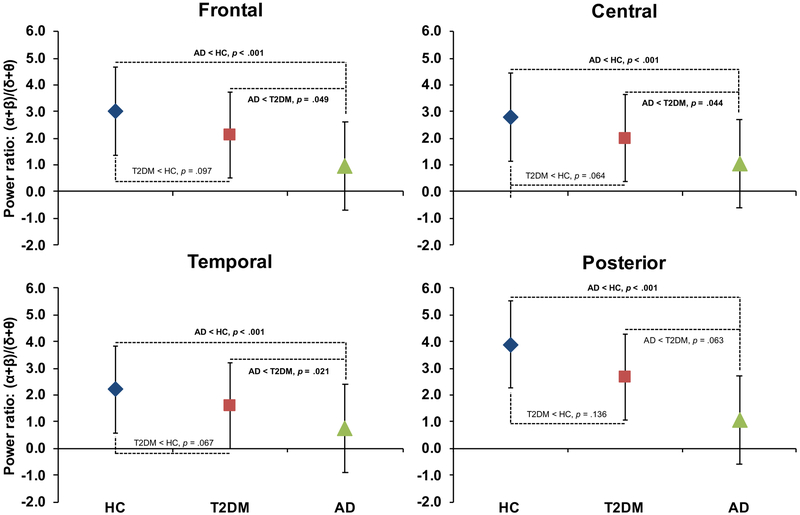
Figure 2. Spectral Power Ratio.
Figure shows the age-adjusted comparison across groups of the Spectral Power Ratio, (α+β)/(δ+θ), estimated from each cortical region of interest (ROI). Tukey’s Honestly Significant Difference post hoc tests demonstrated that (α+β)/(δ+θ) was lower in Alzheimer’s disease (AD) than in Healthy Controls (HC) across all ROIs (p values < 0.001) and lower than Type-2 Diabetes (T2DM) in all but the Posterior ROI (p values = 0.0499–0.063). T2DM was lower than HC across all ROIs though this difference did not reach significance (p values = 0.064–0.136). Data shown represent the least squared means and standard deviations derived from the linear regression models.

