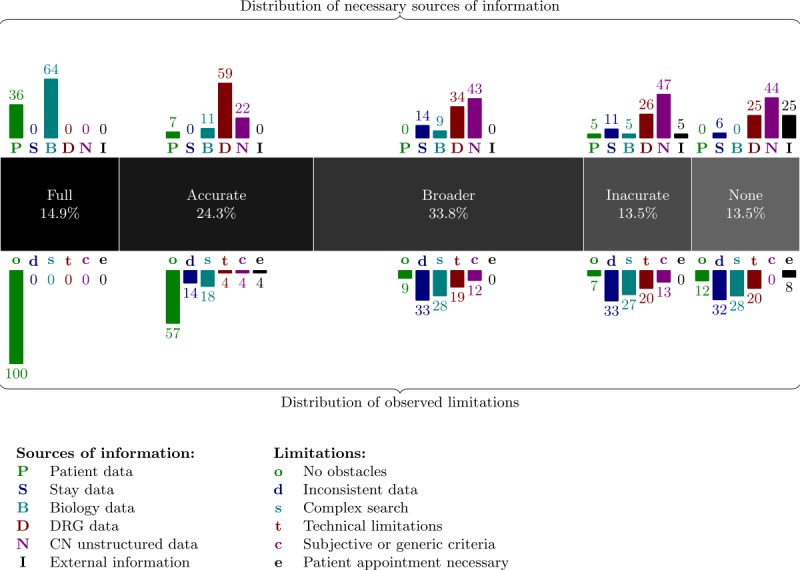
Figure 5.

The central gray band gives the percentage of criteria of each support level excluding not applicable criteria. The upper bars show, for each support level, the percentages of involvement of each source of information in the search of criteria. The lower bars show the distribution (in percentage) of the different obstacle categories identified as lowering the effectiveness of the search of criteria. CN: clinical narrative; DRG: diagnosis-related group.
