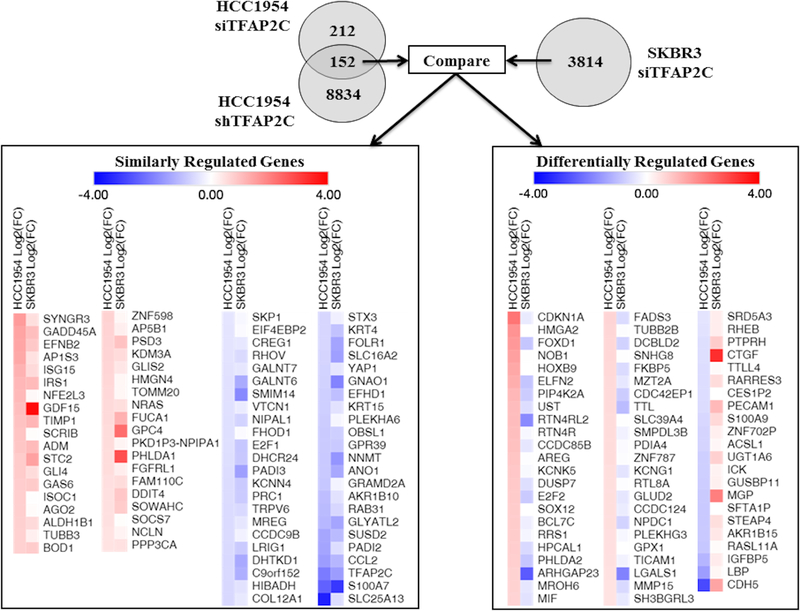
Figure 3. Summary of RNA-seq Data with Knockdown of TFAP2C.
Significant changes in gene expression were first compared in HCC1954 with siRNA or shRNA stable knockdown. The 152 genes with significant and consistent changes were compared to knockdown of TFAP2C in SKBR3 cells with siRNA. Similarly regulated genes (on left) and differentially regulated genes (on right) are summarized with intensity of color indicating direction and magnitude of gene expression changes.

