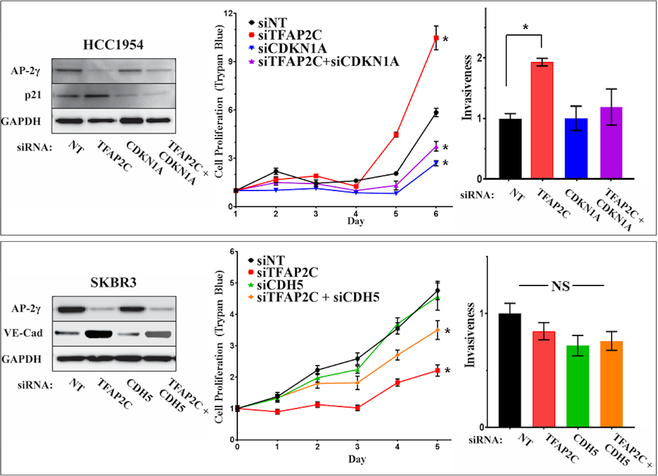
Figure 5. Response of Proliferation and Invasiveness to CDKN1A and CDH5.
HCC1954 cells (top panels) with knockdown of TFAP2C, CDKN1A or both; western blots confirm knockdown of proteins (left panel); proliferation determined by counting viable cells (trypan blue) (middle panel); bar graph showing relative invasiveness in HCC1954 with knockdown of TFAP2C with or without knockdown of CDKN1A (right panel). Parallel experiments in SKBR3 cells (bottom panels) with knockdown of TFAP2C, CDH5 or both; western blots confirm knockdown (left panel); proliferation measured by viable cell counts (trypan blue) (middle panel); bar graph shows relative cell invasiveness (right panel).

