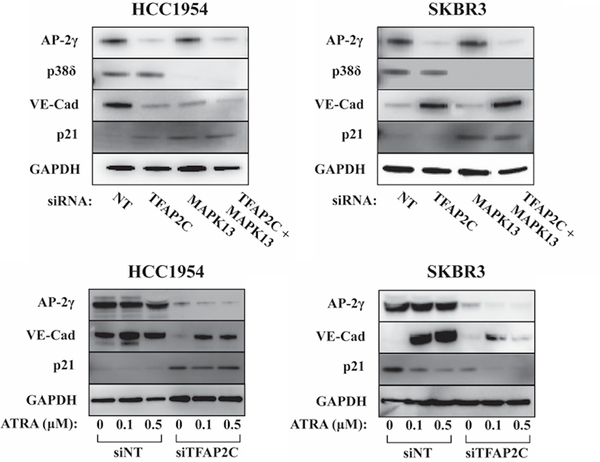
Figure 6. Expression of VE-cadherin and p21 in Response to MAPK13 and ATRA.
Western blots for AP-2γ, p38δ, VE-cadherin, p21 and GAPDH showing response in HCC1954 and SKBR3 cells with knockdown of TFAP2C with or without co-knockdown of MAPK13 (top panels). Western blots showing changes of expression of AP-2γ, VE-cadherin, p21 and GAPDH in HCC1954 and SKBR3 with knockdown using NT vs. TFAP2C siRNA with increasing concentration of ATRA at 0, 0.1 and 0.5 μM (bottom panels).

