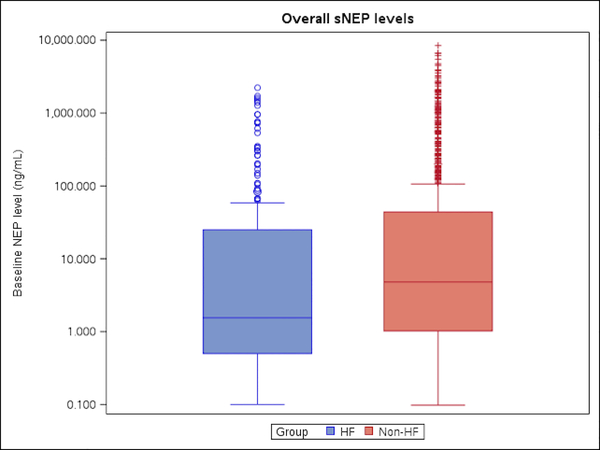
Figure 1. Circulating Soluble Neprilysin Levels in Propensity Matched Cohorts.
To more comprehensively adjust for imbalances between comorbidities, the normal control group was propensity matched to the HFpEF group based on age, body mass index, diabetes, hypertension, renal dysfunction, and smoking history. This figure depicts that after propensity matching, sNEP levels remained lower in the HFpEF group compared to normal controls.

