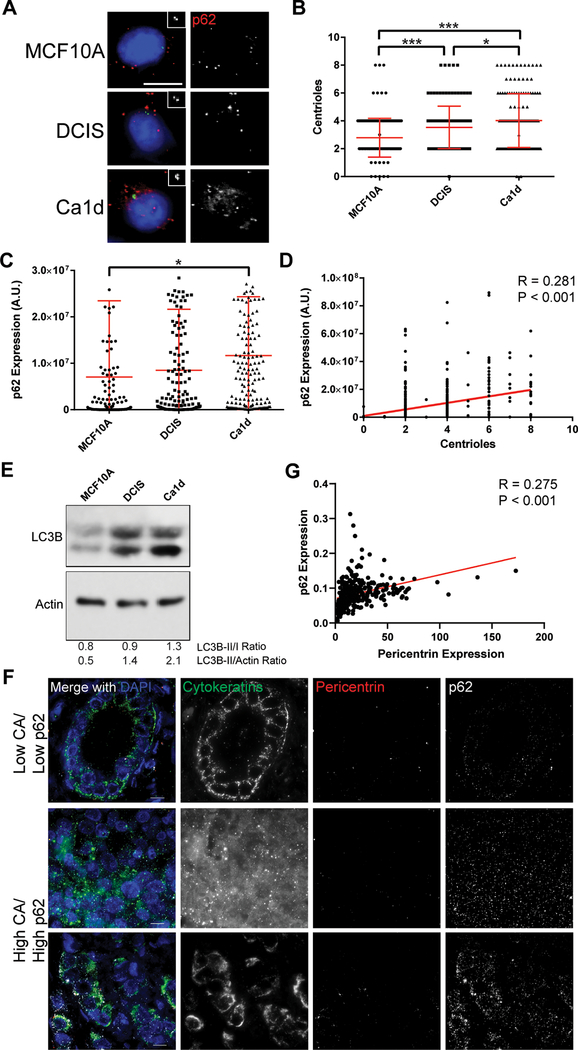
Figure 3: Centrosome amplification correlates with p62 in breast cancer models.
(A) Representative images of MCF10A, DCIS, and Ca1d cell lines, representing benign breast epithelium, ductal carcinoma in situ, and invasive ductal carcinoma, respectively. Insets show enlargements of the centrioles (centrin staining). Blue = DNA/DAPI, green = centrin, red = p62. Scale bar = 10 μm. (B) Correlation of centrioles with p62 expression, quantified from immunofluorescence images. Pearson r = 0.281, P value < 0.001. Data are combined from all 3 cell lines shown in panel A. (C) Quantification of centrioles in each of the 3 cell lines. (D) Quantification of p62 expression in each of the 3 cell lines. ANOVA P value = 0.013, Tukey’s multiple comparisons test demonstrated significant difference between MCF10A and Ca1d (P < 0.015). Dots represent individual cells. Bars represent means ± SD. *P value < 0.05, ***P< 0.001. (E) Western blotting for LC3B and actin loading control. (F) Representative images of primary breast tumors from the breast tissue microarray (TMA) analysis. Tissues were stained for pericentrin (to mark centrosomes and assess centrosome amplification), p62 (to mark autophagosomes and assess autophagy), pan-cytokeratins (to identify epithelial cancer cells), and DAPI (to label nuclei). (G) Correlation of p62 expression with pericentrin expression in the breast TMA. Each dot represents the average of over 300 cells for one tumor.

