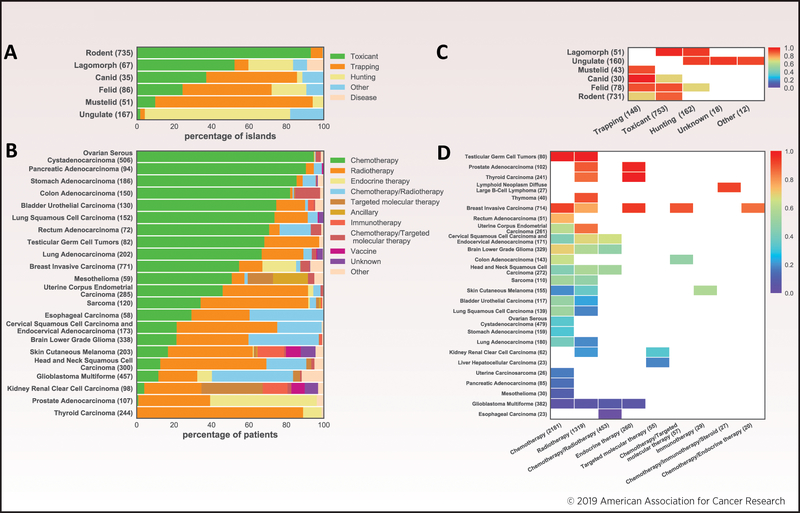
Fig 2. Prevalence of strategies for invasive species eradication and cancer treatment and their success rates.
(A) Percentage of islands that received specific primary eradication strategies, stratified by invasive mammalian species. (B) Percentage of patients that received specific initial treatments, stratified by cancer type. (C) Success rates for different primary treatments. Species are ordered by the mean of their success rates across all treatments. Only eradication cases with at least 10 islands were considered. (D) Five-year survival rate (Kaplan-Meier estimation) for cancer types as a function of initial treatment. Cancer types are ordered by the mean of their survival rates across all treatments. Data in panels (A) and (C) are from the Database of Island Invasive Species Eradications, with the number of islands in each dataset shown in parentheses. Data in panels (B) and (D) are from The Cancer Genome Atlas (TCGA) through TumorPortal [1], with the number of patients in each dataset shown in parentheses.

