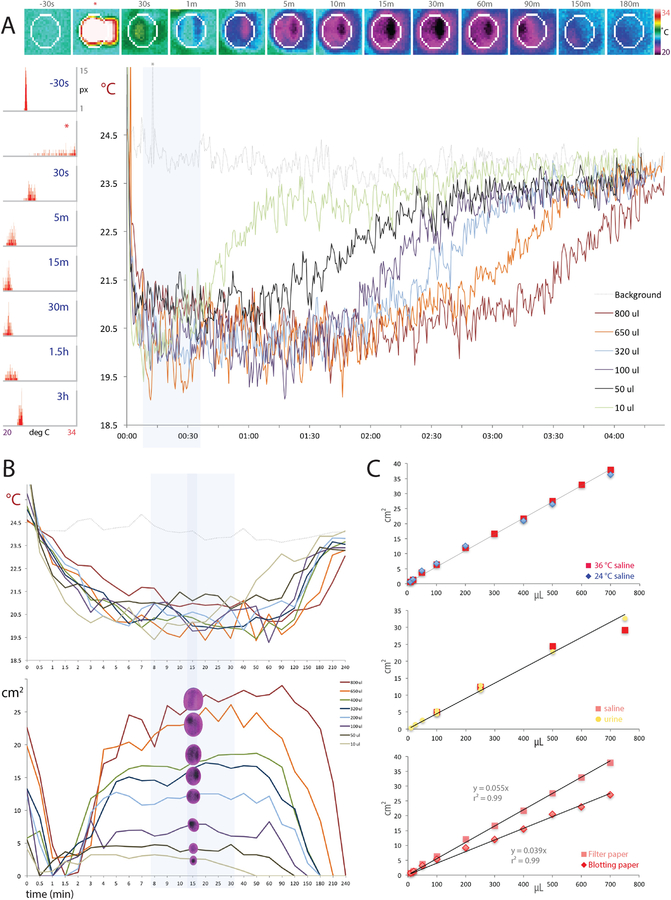
Figure 2.
Thermography calibration data with A35 (A-B) and E40 (C) cameras. (A) Top row images show the evolution of a thermal void spot in blotting paper from 30 seconds prior to 400 μL of warm saline ejection (*) through radial spread and cooling (30s - 90 min), then delayed re-warming back towards the ambient temperature (150–180 min). At right is a thermal pseudocolor scale (20–34 °C). The left-hand column of histograms shows, for all pixels inside the white region of interest (ROI) in the top row of images, the distribution of pixels at each temperature (20–34 °C) across the same 3h span: initially at the ambient temperature, transiently warm upon fluid ejection, then cooling several degrees, followed by a gradual re-warming back towards the ambient temperature. The large graph (at right) shows the minimum-temperature trend across a 4 h recording for calibration fluid volumes ranging 10 μL - 800 μL, encompassing the range of volumes voided by awake mice. Notice that smaller spots re-warm sooner, while larger spots remain cool longer, but all spots cool to a stable, low temperature for roughly 10 to 30 min after ejection (blue highlighted region). (B) Temporal evolution of void spot temperatures (top) and measured areas (bottom) across a 4h span for calibration spots ranging 10–800 μL. The region of thermal and size stability for most spots is highlighted in blue, and a darker blue stripe indicates 15min timepoint optimal for measuring spots. (C) The radial spread of known volumes of saline in filter paper is similar at room temperature (24 °C) and body temperature (36 °C, top), as is the spread of mouse urine relative to saline (both 36 °C, middle), but paper type alters the slope of the area-volume relationship, with saline (36 °C) spreading further in filter paper than in blotting paper (bottom graph).

