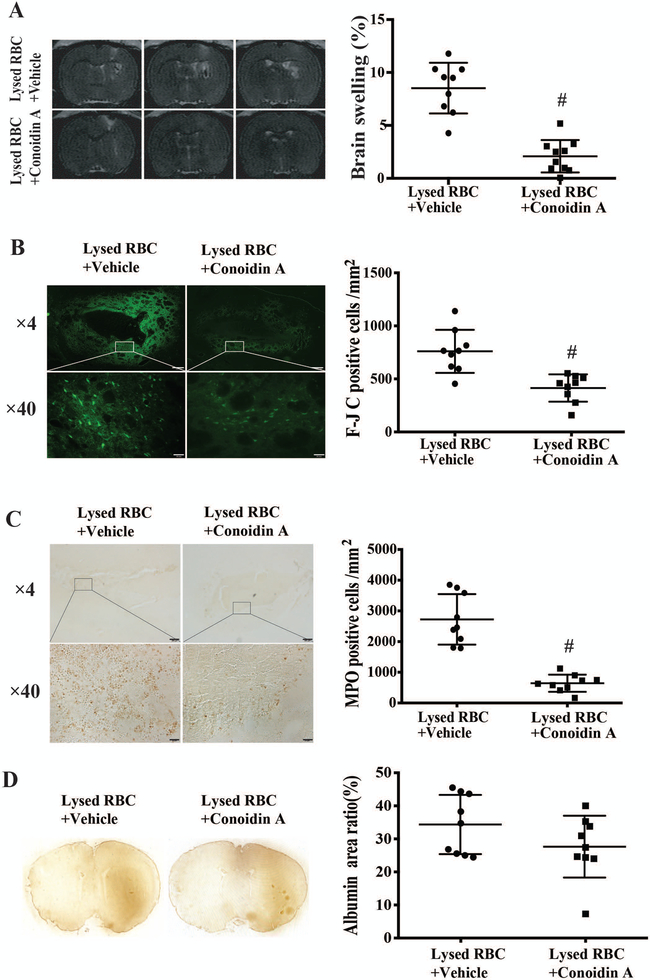
Figure 5.
(A) T2 MRI assessment of brain swelling at day 1 after lysed RBCs + DMSO (vehicle) or lysed RBCs + Conoidin A injection. Values are mean ± SD; n=9 for vehicle, n=10 for Conoidin A; #P<0.01 vs. vehicle by Student t test. (B) Fluoro-Jade C (F-JC) staining showing degenerative neurons in the ipsilateral basal ganglia at day 1 after the co-injection of either vehicle or Conoidin A with lysed RBCs. Values are means ± SD; n=9 for both groups; #P<0.01 vs. vehicle by Student t test. Upper scale bar=200μm, lower scale bar=20μm. (C) MPO staining showing infiltration neutrophils in the ipsilateral basal ganglia at day 1 after intracaudate co-injection of either vehicle or Conoidin A with lysed RBCs. Values are means ± SD; n=9 for both groups; #P<0.01 vs. vehicle by Student t test. Upper scale bar=200μm, lower scale bar=20μm.

