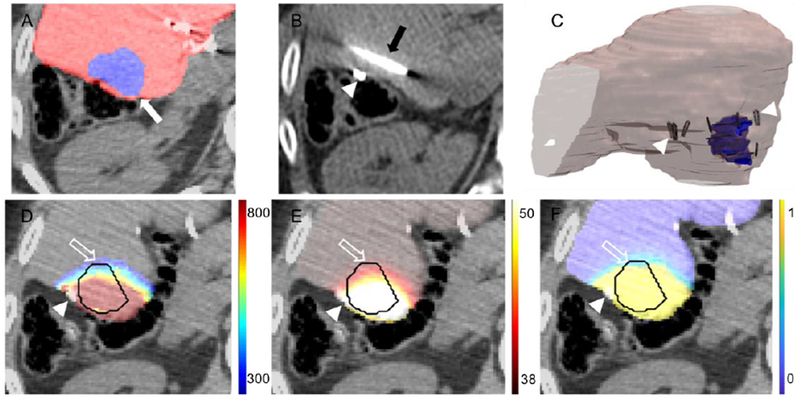
Figure 1.

Workflow of patient specific simulation models. A. Pre-treatment CT images were segmented to extract the tumor (white arrow) and surrounding parenchyma. B. Intra-treatment CT imaging is used to identify the location of clips (arrowhead) and ablation probes (black arrow). C. The segmented images are converted to 3D models, arrowheads indicate location of surgical clips relative to the tumor (outlined in blue). Calculation of D. electric field distribution (units in V/cm), E. thermal damage (units degree centigrade) and F. cell kill probability (fraction 0-1) in the tumor and margin (outline arrow). The tumor is outlined in black, axial cross sections selected to show the tumor at the largest cross section and the relative location of the surgical clips (arrowhead).
