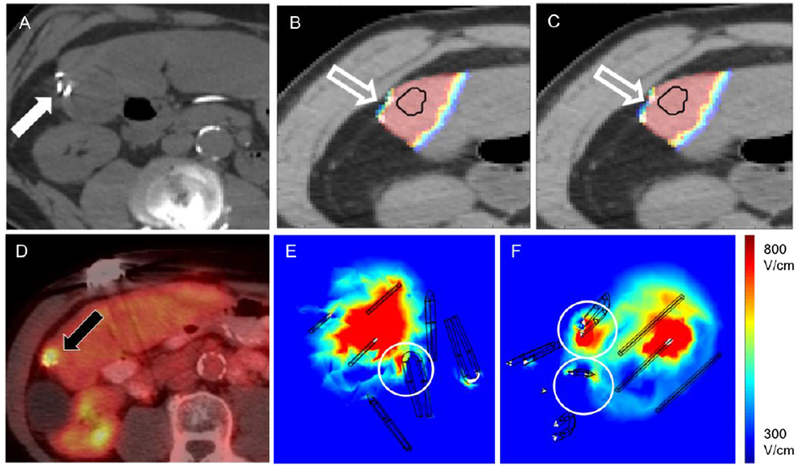
Figure 5.

Simulation model constructed for patient number two. A. Pre-IRE image showing the location of surgical clips within the treatment region (white arrow). Estimate of electric field coverage when simulations were performed B. without or C. with the surgical clips (outline arrows). D. Local tumor progression observed on PET margin. imaging at 24 months post-IRE (black arrow). E,F. Computed electric field distribution in target tissue, distortions are visible in the vicinity of the clips (circles).
