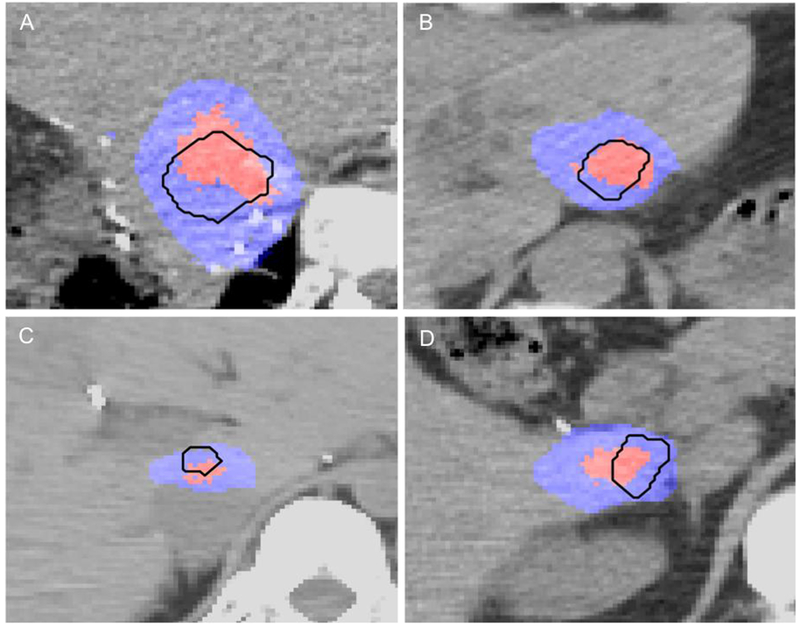
Figure 6.

Volume of thermal damage during IRE in A. Patient number four, B. Patient number five, C. Patient number six and D. Patient number seven. The tumor is outlined in black, the region of thermal damage is depicted in red and the total region of IRE is shown in blue. Tissue was considered ablated (thermally or by IRE) if cell kill probability was above 0.9.
