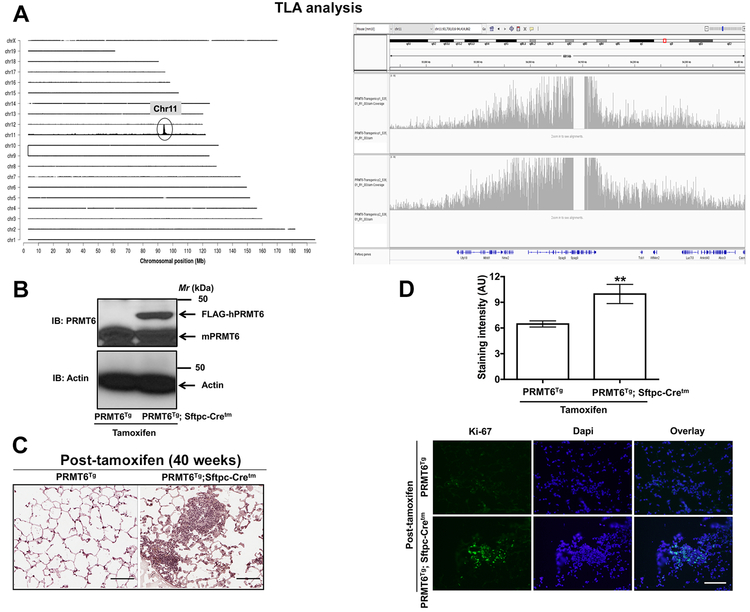
Figure 1. Lung targeted PRMT6 expression accelerates cell proliferation.

A. TLA coverage and analysis plots. Left panel represents the sequence coverage: mouse chromosomes 1 through X are arranged on the Y-axis and X-axis represents chromosomal position. While, right panel displays the graphical representation of transgene integration site and structural changes. B. Tissue lysates from the lungs of PRMT6Tg; Sftpc-Cretm and PRMT6Tg control mice after tamoxifen treatment were subjected to immunoblotting with anti-PRMT6 antibodies that detects both human and mouse PRMT6 isoforms. C, D. 40 weeks after tamoxifen administration to induce PRMT6 expression, lung sections were subjected to H&E staining (C, scale bar: 100 μM) and Indirect immunofluorescence with anti-ki67 antibodies (D, scale bar: 200 μM). Upper panel represents the quantification of ki67 staining, while representative images were displayed in the lower panel. **, p< 0.01; versus PRMT6Tg control.
