
Figure 12.
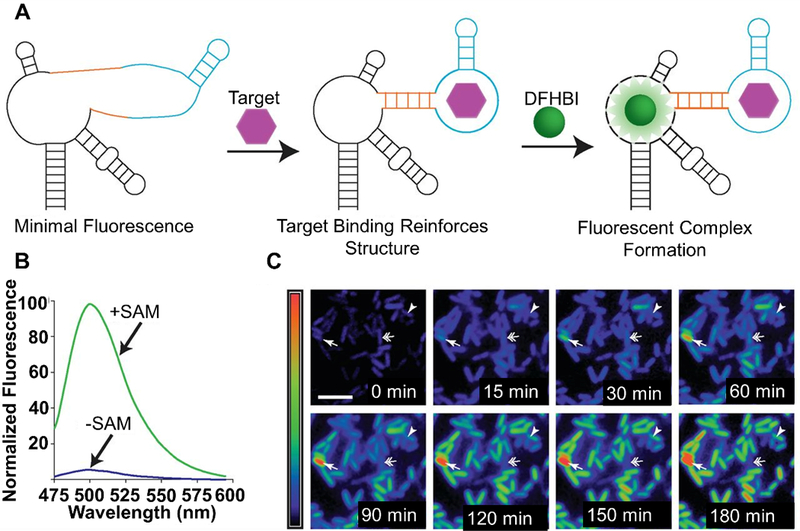
(A) Spinach aptamer composed of Spinach (black), transducer (orange), and aptamer (light blue) for detection of target analytes. Target binding to the aptamer induces a structural change that results in transducer duplexing and concomitant binding of DFHBI to Spinach to give fluorescence turn-on. (B) Fluorescence turn-on of Spinach aptamer in the presence of target SAM. (C) Monitoring of SAM in E. coli cells. Single arrows point to cells with relatively high SAM expression, arrowheads point to cells with increasing levels of SAM over time, while double-arrows point to cells whose SAM content first increases and then decreases over time.[122] Modified with permission from AAAS and authors.