Fig. 4.

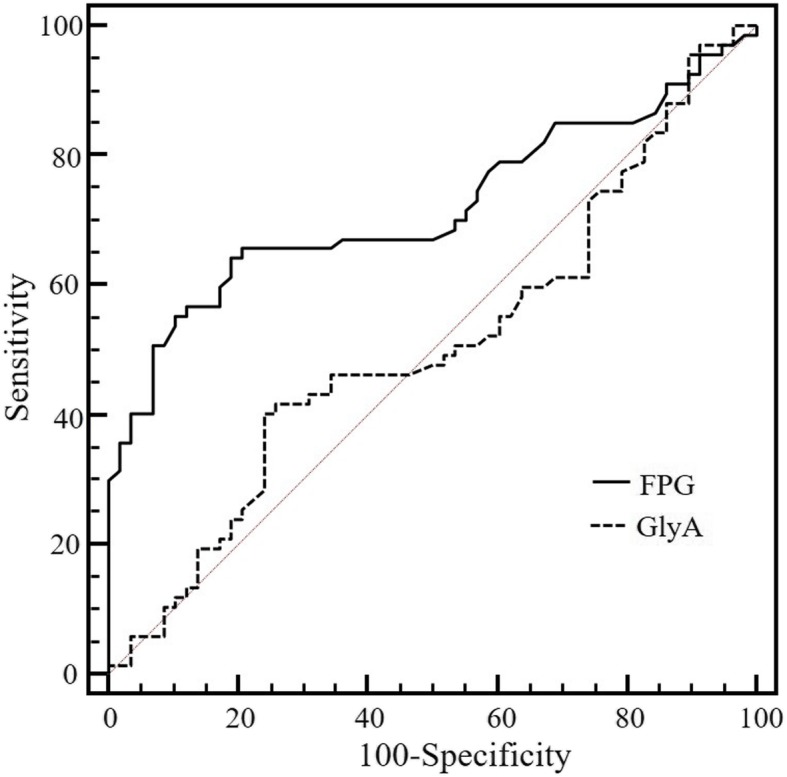
Receiver operating characteristic (ROC) curve analysis of GlyA and FPG at the 24–28 weeks of gestation for diagnosing GDM. The areas under ROC curve were 0.503, (P = 0.957) for GlyA and 0.705 (P < 0.001) for FPG

Receiver operating characteristic (ROC) curve analysis of GlyA and FPG at the 24–28 weeks of gestation for diagnosing GDM. The areas under ROC curve were 0.503, (P = 0.957) for GlyA and 0.705 (P < 0.001) for FPG