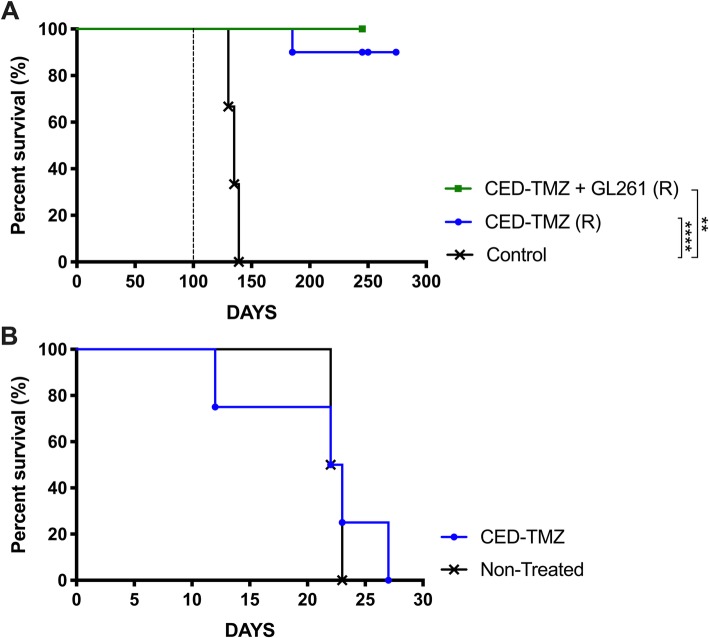
Fig. 3.
Kaplan Meyer survival curve of mice bearing GL261 glioma showing; (a) C57BL/6 mice initially treated with CED-TMZ + GL261 (R) (n = 5) and CED-TMZ (R) as monotherapy (n = 10) re-challenged at day 100 (dotted line) with 5 × 10³ GL261 cells into the contralateral hemisphere with without further treatment. Control mice were injected simultaneously. Log-rank test analysis showed significantly prolonged survival compared to non-treated mice (n = 4). CED-TMZ + GL261 (R) vs. control (**p = 0.0027). CED-TMZ monotherapy (R) vs. control (**** p < 0.0001). Survival was monitored for a total of 300 days. b Any difference in prolonged survival between NOD-Scid mice receiving CED-TMZ (n = 4) at days 7–9 administered via micro-osmotic pump/brain infusion kit (total dose of 180 μg) and non-treated Nod-Scid mice (n = 4). CED-TMZ vs. non-treated (p = 0.7740). Survival was monitored for 100 days

