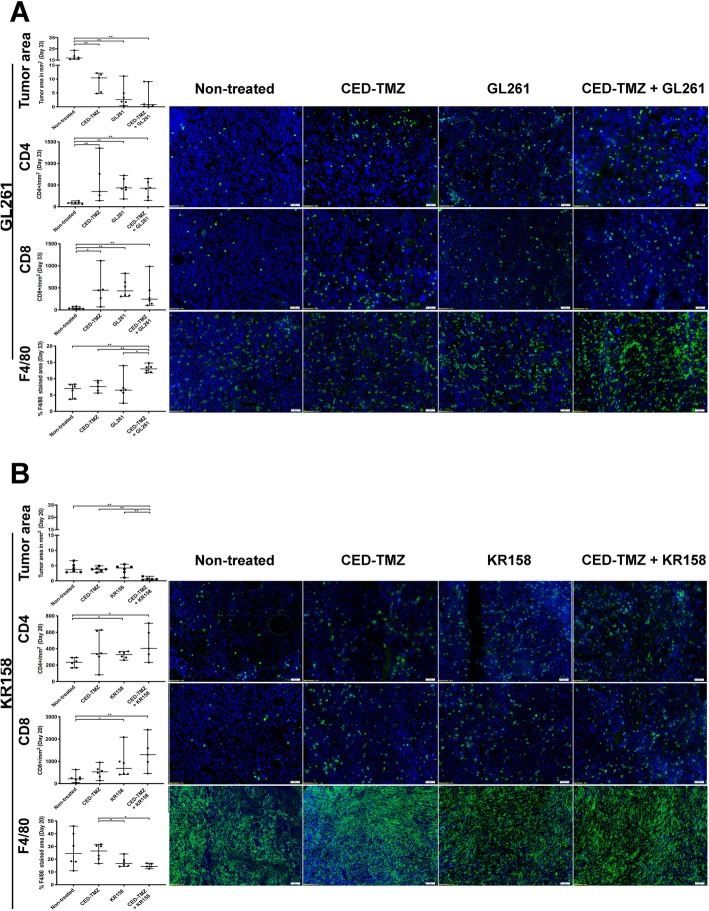
Fig. 4.
Analysis of frozen brain sections harboring GL261 or KR158 glioma at day 33 and 20, respectively. Groups included for GL261 (a) were; non-treated (n = 6), CED-TMZ (n = 5), GL261 (n = 6), CED-TMZ + GL261 (n = 6), and for KR158 (b); non-treated (n = 6), CED-TMZ (n = 6), KR158 (n = 6), CED-TMZ + KR158 (n = 5). Immunohistochemistry staining of intratumoral immune cells population (CD4+, CD8+ T-cells and F4/80+ macrophages) in green and nuclear staining DAPI in blue of mice treated with TMZ and/or immunotherapy compared to non-treated. Representative images from one animal of each treatment is presented. Images were taken at 20x magnification. Scale bar 50 μm. Histograms show quantitative analysis of tumor area and the intratumoral number of CD4+ and CD8+ T cells per area (mm2); and qualitative analysis of the percentage of tumor stained area of F4/80+ macrophages. The error bars display the median and the range of the group while each dot represents the average value of 3 stained cryosections per tumor. Significant differences between treatments conditions were obtained using unpaired nonparametric Mann-Whitney U test

