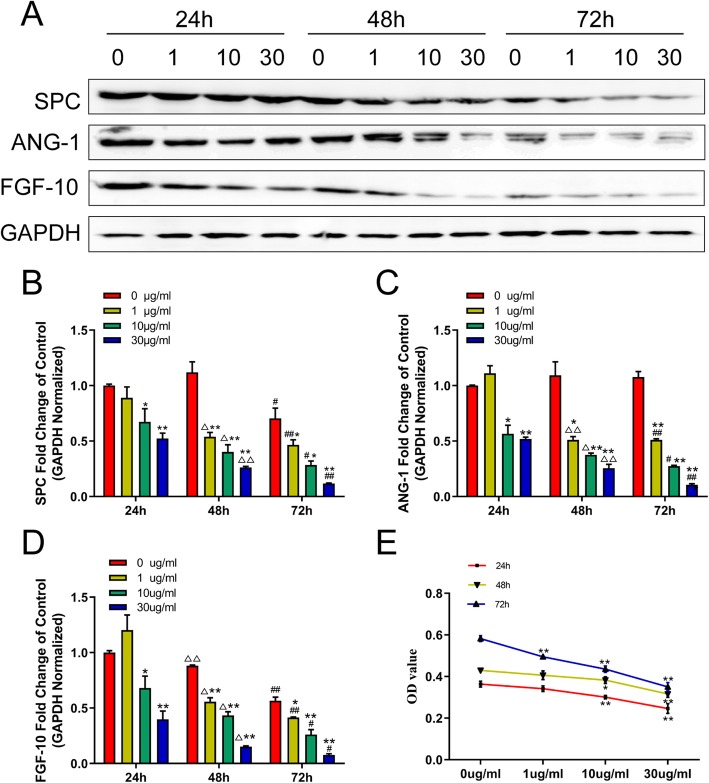
Fig. 2.
LPS stimulation could affect SPC, Ang-1, and FGF-10 expression and cell viability of hCMSCs. Western blot (a): hCMSCs were exposed to LPS from 0 to 30 μg/ml; RT-qPCR (b, c, d): values were calculated as the fold change of 2−△△Ct levels of 0 μg/ml LPS at 24 h (1, 10, and 30 μg/ml at each hour node versus 0 μg/ml, *P < 0.05, **P < 0.01; 0, 1, 10, and 30 μg/ml at 48 h versus at 24 h, △P < 0.05, △△P < 0.01; 0, 1, 10, and 30 μg/ml at 72 h versus at 24 h, #P < 0.05, ##P < 0.01); MTT assay (e) detected the cell viability of hCMSCs treated with 0, 1, 10, and 30 μg/ml LPS after 24, 48, and 72 h of culturing (1, 10, and 30 μg/ml at each hour node versus 0 μg/ml, *P < 0.05, **P < 0.01). Data are represented as mean ± SD

