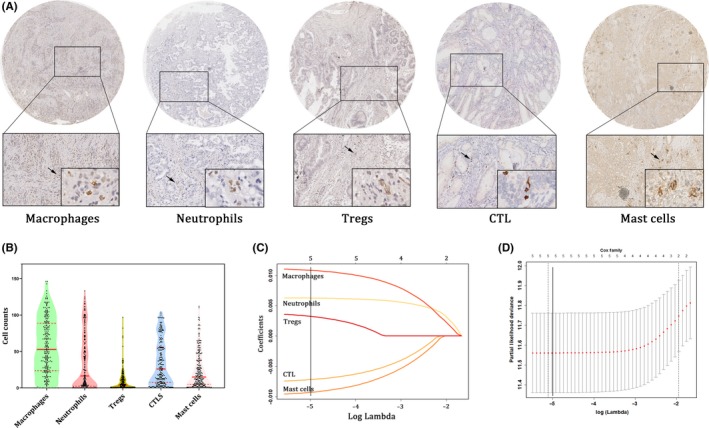
Figure 2.

Construction of immune index model. A, Infiltration of macrophages, neutrophils, regulatory T cells (Tregs), cytotoxic T cells (CTL) and mast cells in GBC patients with 200× magnification. B, Violin plot showing the cell count distribution of the selected immune cells. C, Least absolute shrinkage and selection operator (LASSO) coefficient profiles of the selected immune cells. A solid vertical line is drawn at the value (log λ = −5) chosen by fivefold cross‐validation. D, Partial likelihood deviance for the LASSO coefficient profiles. A light dashed vertical line represents the minimum partial likelihood deviance. A solid vertical line represents for the partial likelihood deviance at the value (log λ = −5)
