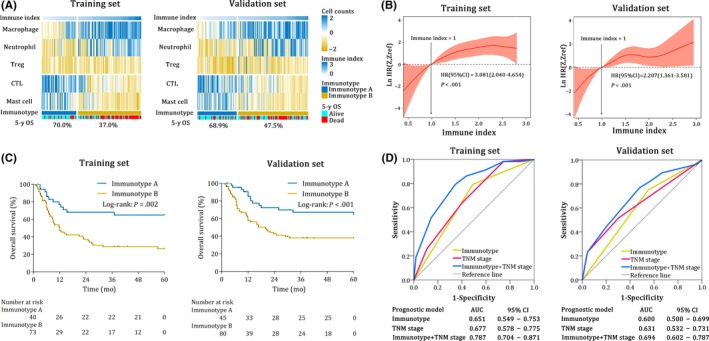
Figure 3.

Prognostic efficiency of the immune index model in the training set and the validation set. A, Heat map classifying patients according to the levels of the immune index from left to right. The colors represent the relative counts of five immune cells in every patient. The 5‐year OS of different groups is indicated. B, Smooth hazard ratio (HR) curves show increasing HR of increasing immune index; immune index = 1 in the training set and the validation set. HR and 95% CI are calculated by univariate Cox regression. C, Kaplan‐Meier analysis of overall survival (OS) of gallbladder cancer (GBC) patients based on immunotype in the training set and the validation set. D, The receiver operating characteristic (ROC) and area under curve (AUC) of immunotype, TNM stage and TNM stage + immunotype. CI, confidence interval; HR, hazard ratio
