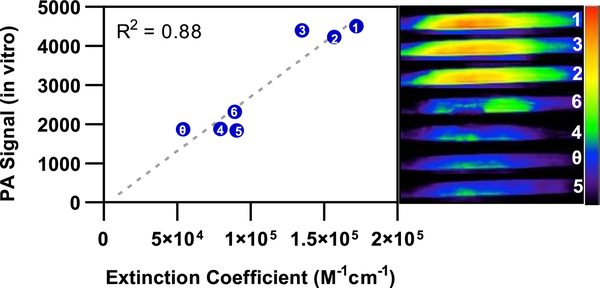
Figure 3.
Linear correlation between extinction coefficient and measured in vitro PA signal (10 μM, CHCl3, in tissue-mimicking phantom) of red-HyP-1 (indicated by the θ) and analogues 1–6 (labeled in white). Representative in vitro PA images are displayed on the right, in decreasing order of intensity.

