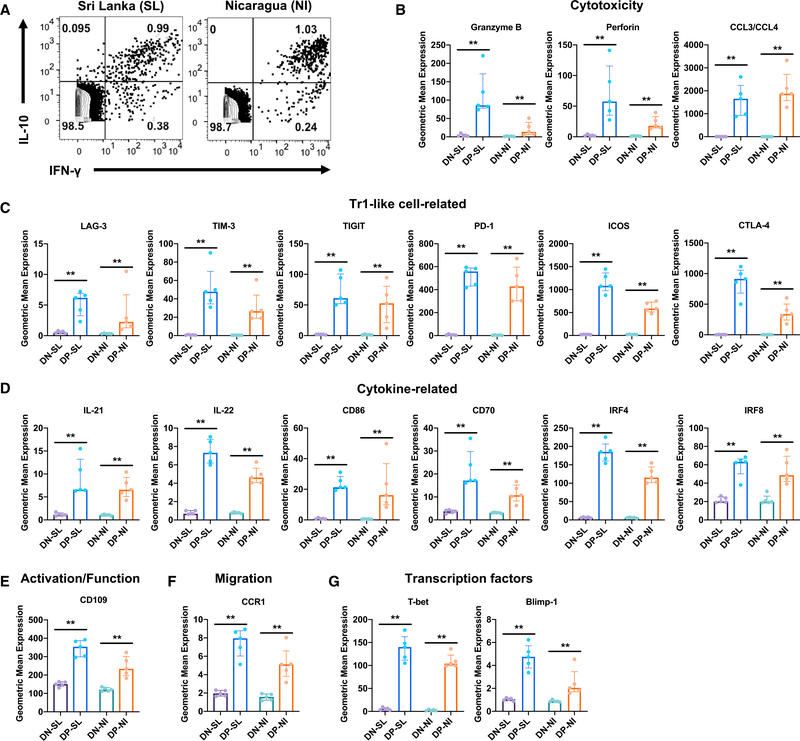
Figure 6. Validation of DE Genes in DENV-Specific DP Cells at the Protein Level.
Human PBMCs isolated from Sri Lankan (SL, n = 5) and Nicaraguan (NI, n = 5) patients with acute DENV infection were stimulated with DENV MP, and the expression of various molecules was measured by CyTOF.
(A) Dot plots show the production of IFN-γ and IL-10 by CD4 T cells.
(B–G) Bar graphs show the protein expression in geometric mean values for molecules related to (B) cytotoxicity, (C) Tr1-like cells, (D) cytokines, (E) T cell activation/function, (F) migration, and (G) transcription factors in DN and DP cells.
Error bars show medians with interquartile ranges. Statistical significance was determined by two-tailed Mann-Whitney test. **p < 0.01.

