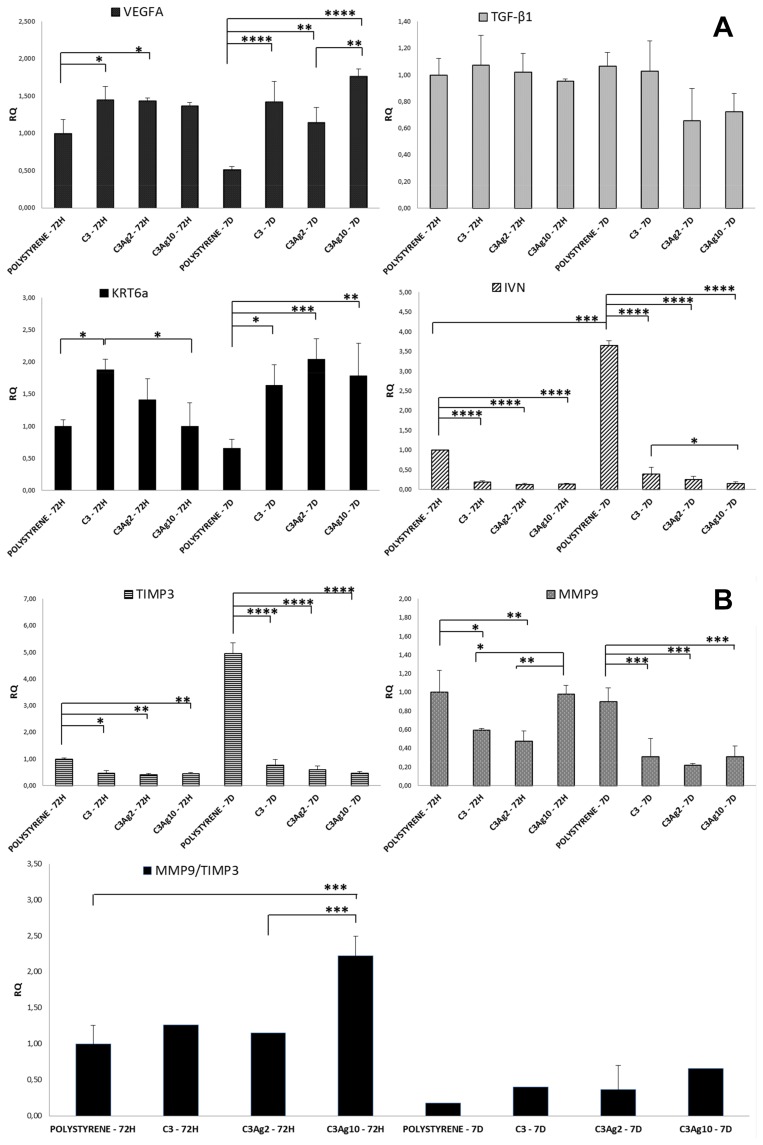
Figure 12.
(A) and (B) Gene expression profile of HaCaT cells following incubation with C3Ag2 or C3Ag10. RT-qPCR analysis of HaCaT cells at 72 hrs and 7 days incubation with C3Ag2 or C3Ag10 shows an increase in the expression of genes involved in tissue repair and a decrease in the expression of MMP9. The diminished IVN expression levels show that cells incubated with C3 are kept in a more undifferentiated stage as compared to polystyrene. Data are expressed as mean (SD). P values ≤0.05 were considered to be statistically significant (*p≤0.05; **p≤0.01; ***p≤0.001; ****p≤0.0001).

