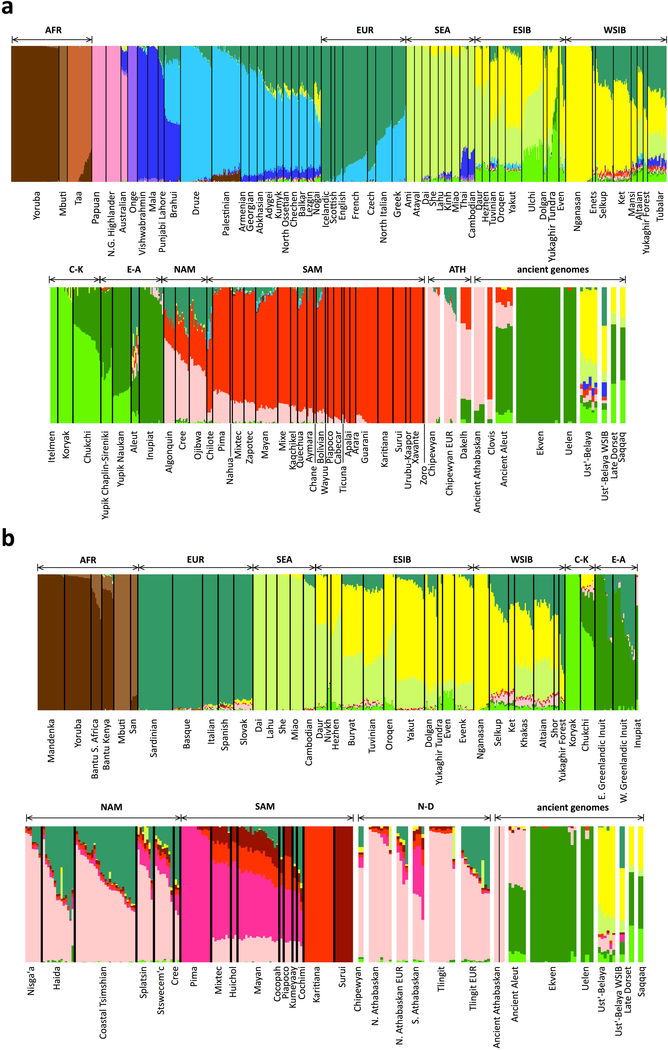
Extended Data Figure 8. ADMIXTURE analysis.
Shown are results for the HumanOrigins (a) and Illumina (b) SNP array datasets. The number of source populations in ADMIXTURE is 14 and 11, respectively. One hundred iterations were calculated for each value of K from 5 to 20 (where K is the number of ancestral populations), and the optimal K values were selected based on ten-fold cross-validation. Contributions from hypothetical ancestral populations are color-coded, and meta-populations used in this study are indicated above the plot: AFR, Africans; EUR, Europeans; SEA, Southeast Asians; ESIB, East Siberians; WSIB, West Siberians; C-K, Chukotko-Kamchatkan speakers; E-A, Eskimo-Aleut speakers; NAM, northern First Peoples; SAM, Southern First Peoples; ATH, Northern Athabaskan speakers; N-D, Na-Dene speakers. Chipewyan or Northern Athabaskan and Tlingit individuals with European admixture are plotted in separate bars, as well as ancient individuals: Clovis, Northern Athabaskans, Aleuts, Chukotkan Neo-Eskimos (Ekven and Uelen sites), Saqqaq and Late Dorset Paleo-Eskimos, and a genetically heterogeneous Ust’-Belaya Angara Siberian population (Ust’-Belaya WSIB, an undated individual I7760 having a West Siberian genetic profile according to PCA and this ADMIXTURE analysis; Ust’-Belaya, the remaining 8 individuals from the Ust’-Belaya Angara site having a distinct genetic profile according to our PCA analysis). Outliers, including individuals admixed with Europeans and East Asians, were not removed from Na-Dene-speaking populations in the Illumina dataset (b) to preserve their maximal diversity. Outliers were removed for the purpose of other analyses (qpAdm, f4-statistics, etc.) that rely on pre-defined populations.

