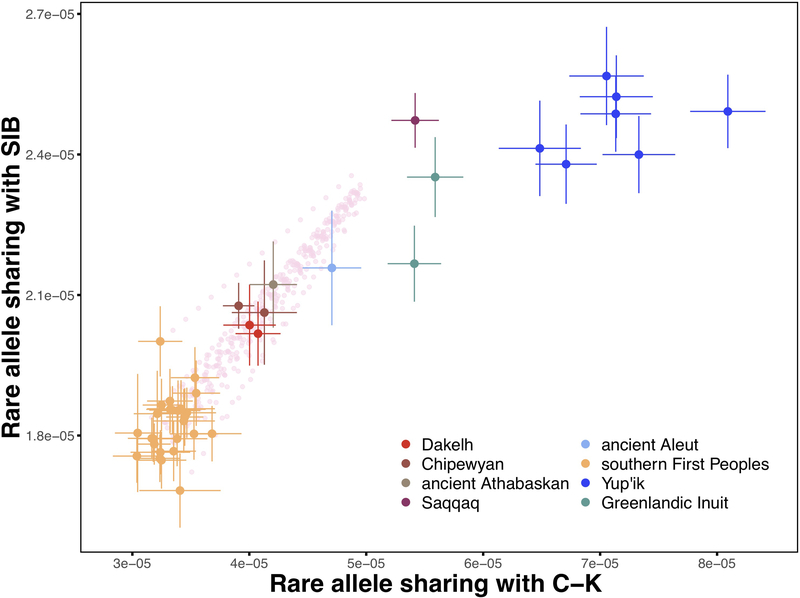
Extended Data Figure 6. Rare allele sharing analysis.
A two-dimensional plot of Chukotko-Kamchatkan (C-K) and Siberian (SIB) rare allele sharing statistics for First Peoples, Na-Dene-speaking, Eskimo-Aleut-speaking, and Paleo-Eskimo individuals. Rare alleles occurring from 2 to 5 times in the reference set of 238 haploid genomes (0.8–2.1% frequency) contributed to the statistics; the Chukchi individual was dropped from the C-K reference group, and the transversion-only dataset was used. Thus, this analysis was based on 918,474 loci. The sample size for this analysis equals 238 + 2 haploid genomes in a target individual since individuals were analyzed separately. Standard deviations were calculated using a jackknife approach with chromosomes used as resampling blocks. Single standard error intervals and means are plotted. Populations and meta-populations are color-coded according to the legend. Rare allele sharing statistics for simulated mixtures of any present-day southern Native American individual and the Saqqaq individual (from 5% to 75% Saqqaq ancestry, with 5% increments) are plotted as semi-transparent pink circles. Plots for the 2 to 10 allele frequency range and other versions are shown in Supplementary Information section 8.

