Fig. 4.

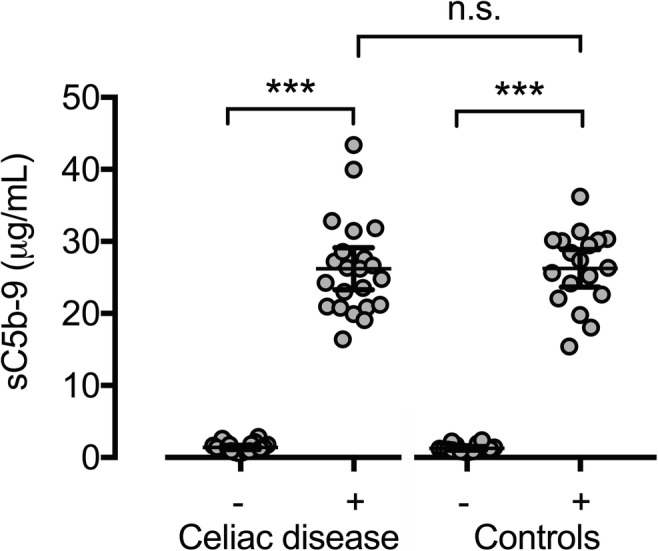
Distribution of sC5b-9 in individuals with CD and controls before and after pneumococcal stimulation. Bars representing mean and 95%CI. (−) Non-stimulated samples. (+) Stimulated samples

Distribution of sC5b-9 in individuals with CD and controls before and after pneumococcal stimulation. Bars representing mean and 95%CI. (−) Non-stimulated samples. (+) Stimulated samples