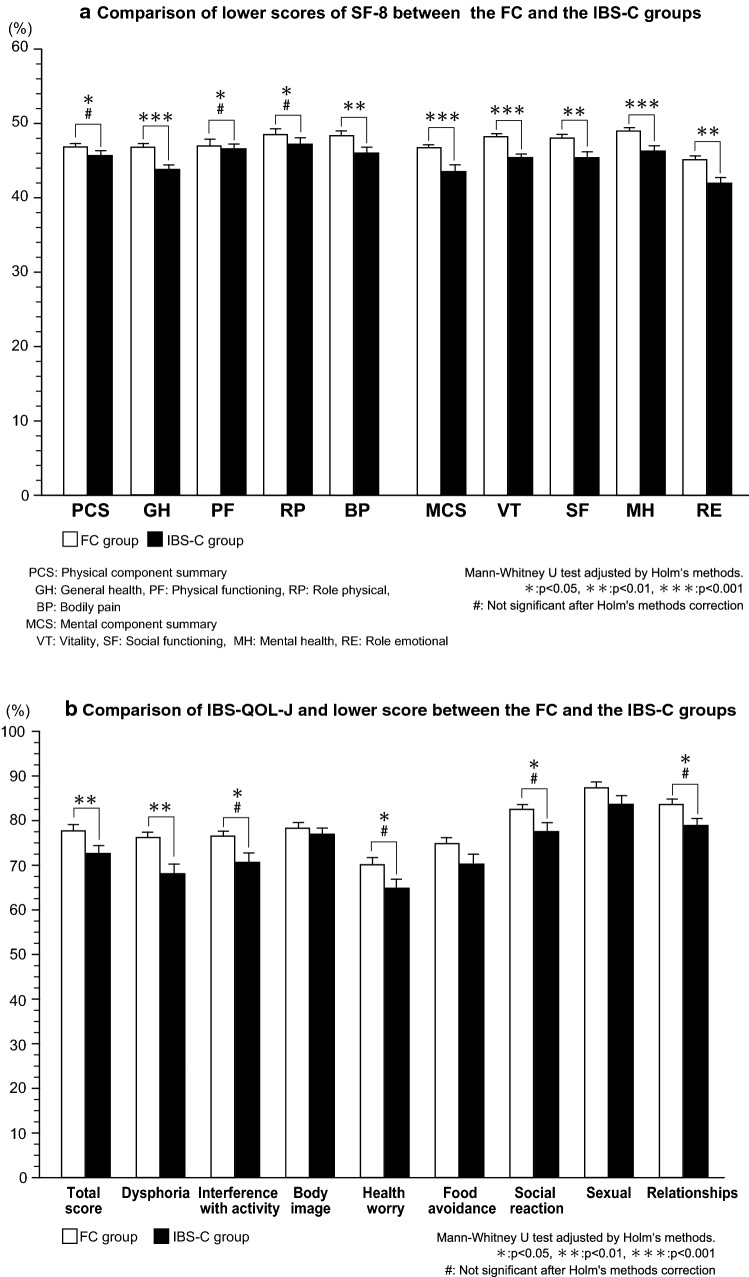
Fig. 4.
a Comparison of lower scores of SF-8 between the FC and the IBS-C groups. PCS physical component summary, GH general health, PF physical functioning, RP role physical, BP bodily pain, MCS mental component summary, VT vitality, SF social functioning, MH mental health, RE role emotional. Mann–Whitney U test adjusted by Holm's methods. *p < 0.05, **p < 0.01, ***p < 0.001. #Not significant after Holm's methods correction. b Comparison of IBS-QOL-J and lower score between the FC and the IBS-C groups. Mann–Whitney U test adjusted by Holm's methods. *p < 0.05, **p < 0.01, ***p < 0.001. #Not significant after Holm's methods correction

