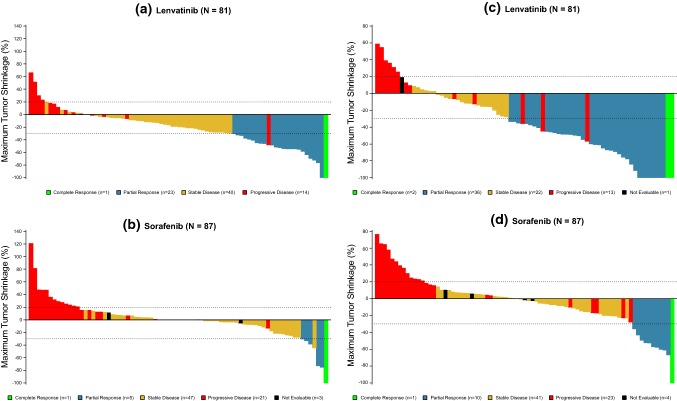
Fig. 2.
Waterfall plot showing maximum changes in tumor size in the Japanese patients by lenvatinib and sorafenib. Target regions of tumors were examined in the individual patients and assessed for tumor size by local investigators (a, b) and by masked independent imaging review (c, d) according to mRECIST. The waterfall plot represents maximum changes in tumor size of each patient receiving lenvatinib (a, c) and sorafenib (b, d)

