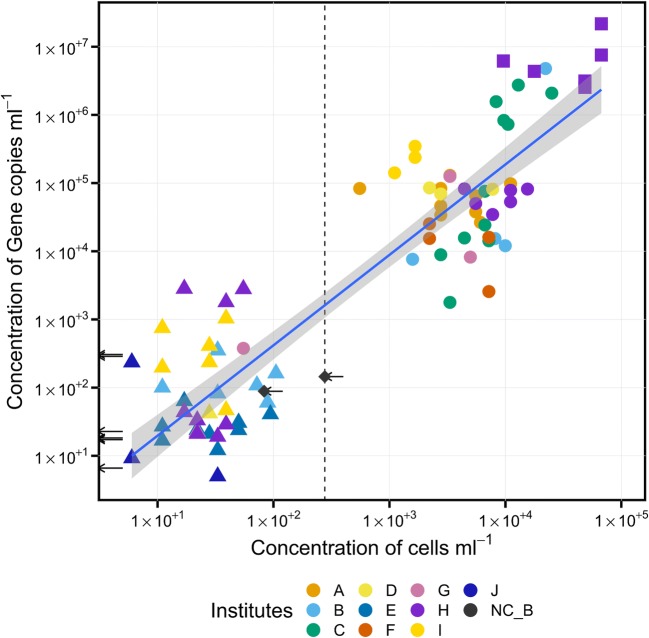
Fig. 3.
Correlation of gene copy numbers and cell counts. A clear separation of ice (circles) and LN (triangles) samples could be observed. The arrows indicate the gene copy numbers of the negative controls. A clear separation of ice (circles) and LN (triangles) samples could be observed. The negative control (diamonds, NC_B) with the highest cell number determined the threshold for the detection limit, illustrated by a vertical dashed line. The axes are log10-scaled. The LN samples are in the range of the negative controls. The debris samples (squares) had the highest gene copy numbers and cell counts. The concentration is calculated per ml evaporated LN, thawed ice, air volume reaction tube (NC_B)

