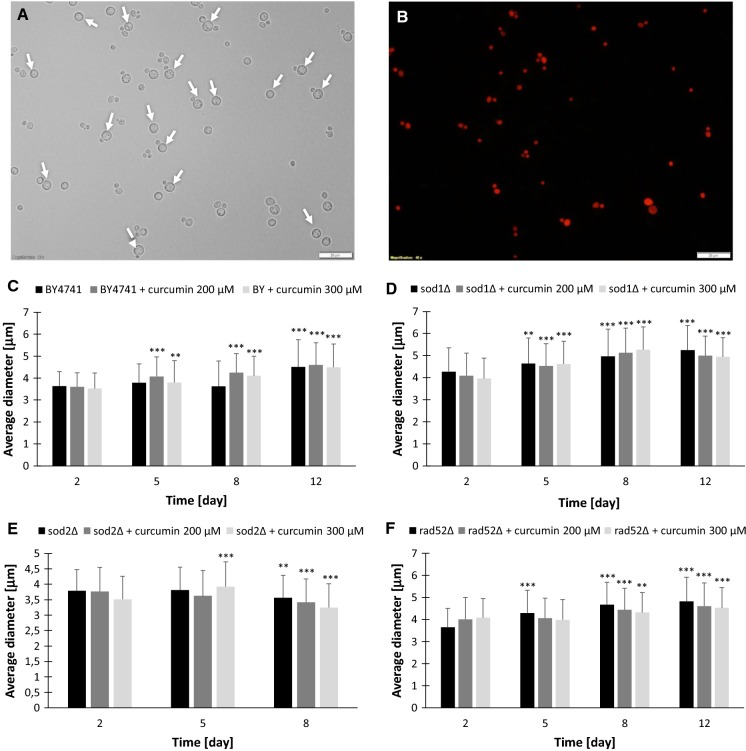
Fig. 4.
Changes in cells diameter during chronological lifespan. Only hypertrophic cells are able to survive. Representative image with propidium iodide staining of BY4741 with 200 mM curcumin treated (a, b). Cells growth up during stopping cell cycle (c–f). Statistical significance was assessed using ANOVA and the Dunnett’s post hoc test (**p < 0.01, ***p < 0.001) compared to the control (2 day). Bars indicate SD. Arrow indicate hypertrophic live cells

