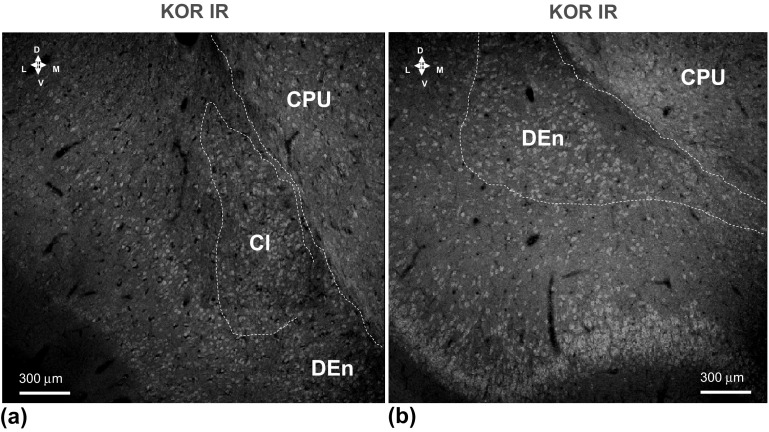
Fig. 5.
Illustration of the KOR (in green) single immunofluorescence studies in the claustrum (a) and in the dorsal endopiriform nucleus (b) of the rat brain. Microphotographs from coronal sections of rat brain at Bregma ( + 1.00 mm) level. A very high density of strongly KOR IR nerve cell bodies (in green) is observed within the claustrum (a) and in the DEn (b). A moderate to high density is observed in the CPU (a, b) and a high to very high density in the piriform cortex (b). Images are representative for the three rats studied. Scale bars are shown. Cl Claustrum, CC corpus callosum, DEn dorsal endopiriform nucleus (Color figure online)

