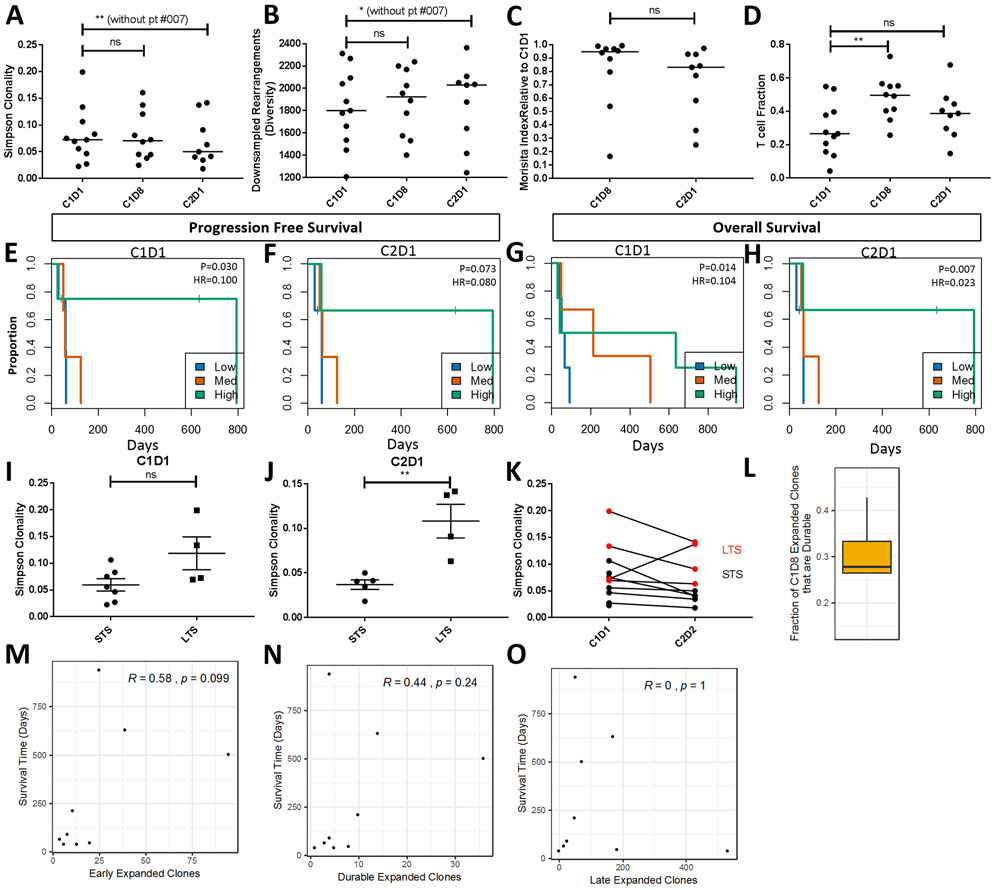
Figure 3. Changes in T cell clonality correlate with clinical outcome.
(A) Analysis of median Simpson clonality, (B) median diversity (expressed as down sampled rearrangement), (C) Morisita index between C1D1 and C2D1, and (D) T-cell fraction (the number of T cells relative to the total nucleated cells) during the first cycle of treatment at C1D1, C1D8, and C2D1 for each patient. Kaplan-Meier analysis examining progression free survival by clonality at C1D1 (E) and C2D1 (F). P-values and hazard ratio were determined using clonality as a continuous variable in the Cox regression, while high, medium and low splits were used for visualization in Kaplan-Meier plot. Kaplan-Meier analysis examining overall survival by clonality at C1D1 (G) and C2D1 (H), statistics and plots were generated as in E-F. For both PFS and OS analysis clonality was scaled to a unit of 0.1 for generating the hazard ratio. Patient level Simpson clonality values at C1D1 (I) and C2D1 (J) and the associated changes during the first cycle of treatment (K). The fraction of T cell clones that expand at C1D8 and are durable at C2D1 (L). Spearman Rho correlations examining the relationship between overall survival and (M) early expanded clones, (N) durable expanded clones, and (O) late expanded clones. ns = not significant; * = p-value ≤ 0.05; ** = p-value ≤ 0.01.

