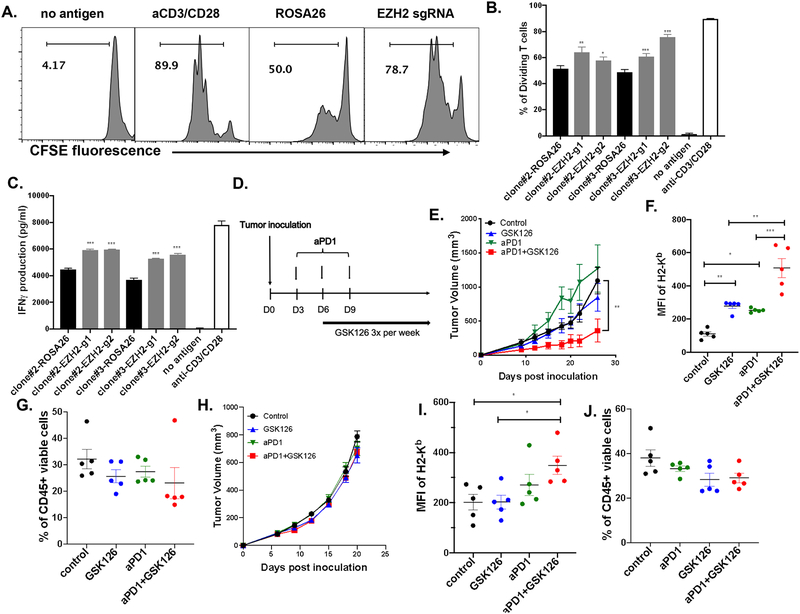
Figure 6. Combinatorial therapy of GSK126 and anti-PD-1 suppresses MOC1-esc1 tumor progression.
A. Representative histogram plots showing T cell proliferation in experimental and control conditions. IFNγ pre-treated EZH2 edited and control cells were pulsed with 1 μM SIINFEKL peptide at 37 degree for 2 hours and co-cultured with CFSE labeled naïve OT-1 cells at an E:T ratio of 10:1 for 72 hours. T cell proliferation was analyzed by flow cytometry. No Antigen condition represents CFSE labeled T cells without tumor cells. The data are representative of 2 independent experiments and shown as Mean ± SD. B. Quantitative analysis of proliferating T cells between indicated conditions. C. IFNγ concentration was measured in the co-culture media by ELISA. D. Schematic of experimental design for in vivo combination therapy. E. C57BL/6 mice (n=4) inoculated subcutaneously with MOC1-esc1 (10^6) cells. Anti-PD-1 antibody was IP injected on Day 3, 6, and 9 post-inoculation. GSK126 was IP injected 3 times a week starting from Day 6 post-inoculation and tumor growth was monitored. The data are representative of 2 independent experiments and shown as Mean± SEM. F, G. Tumors were harvested on D12 post-inoculation. H2-Kb on tumor cell surface (CD45 negative) and percentage of CD45+ cells in each indicated condition were analyzed by flow cytometry. H. The effect of indicated treatment on MOC2 tumor progression (n=10). I, J: MOC2 tumors were harvested on D22 post-inoculation (n=5). H2-Kb on tumor cell surface (CD45 negative) and percentage of CD45+ cells in each indicated condition were analyzed by flow cytometry. *P<0.05, **P<0.01, ***P<0.001. Significance was calculated by one-way ANOVA and 2-way ANOVA.

