Fig. 2.

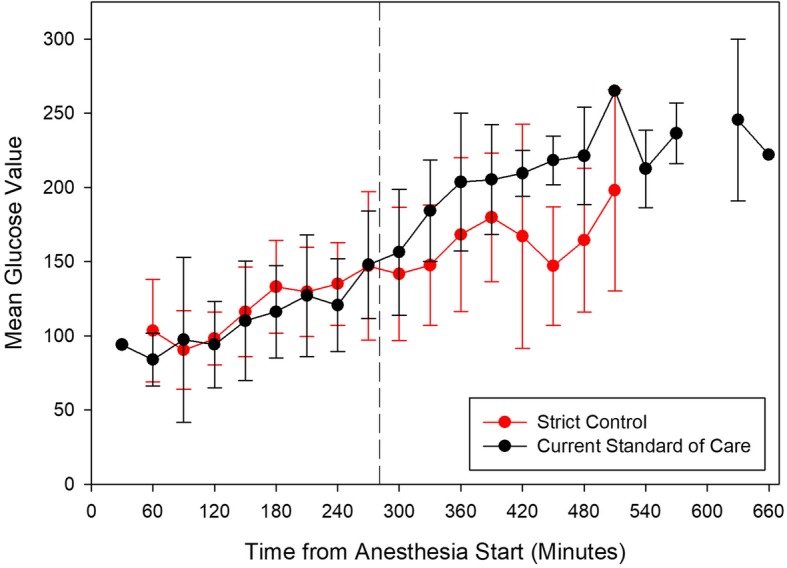
Mean intraoperative blood glucose with 95% confidence intervals for standard and strict glycemic control groups. The vertical dashed line represents the median revascularization time, which was similar in both groups

Mean intraoperative blood glucose with 95% confidence intervals for standard and strict glycemic control groups. The vertical dashed line represents the median revascularization time, which was similar in both groups